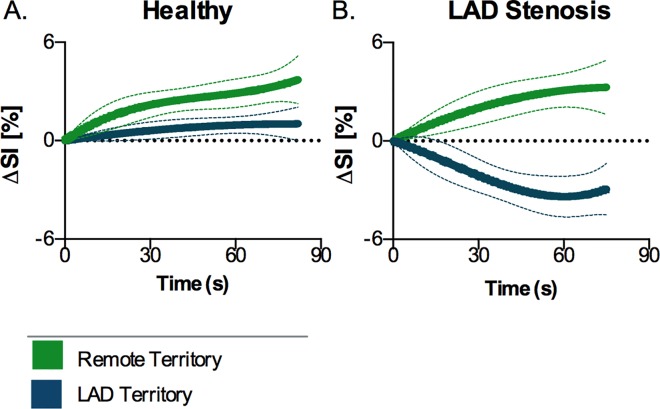
Fig 5. Myocardial oxygenation response curve during the HVBH.
Signal intensity increases globally during the HVBH in control animals (A), yet the animals with a stenosis (B) show a significant decrease in the LAD territory (blue), while the remote region (green) remains above baseline with a similar characteristic of the control animals.

