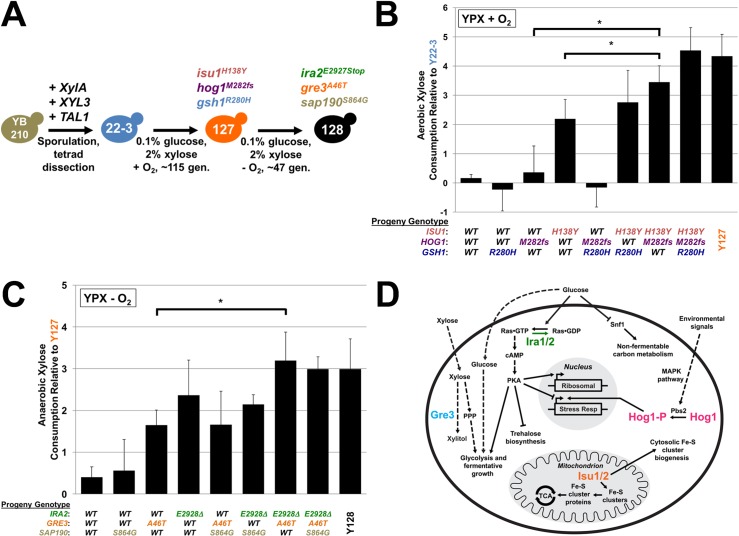
Fig 1. Mutations in ISU1, HOG1, GRE3 and IRA2 co-segregate with the evolved xylose metabolism phenotypes.
The schematic diagram in (A) summarizes the genetic engineering and evolution of the engineered and evolved strains used in this study. Evolved strains were backcrossed to their corresponding ancestral strain and resulting progeny were genotyped and phenotyped for their abilities to consume xylose from lab media relative to the ancestor. Bar graphs represent average Log2 fold-differences of xylose consumed by individual spores from Y22-3 x Y127 (B) or Y127 x Y128 (C) backcrosses relative to their parental strains. Average differences and standard deviations were determined from 2–5 independently generated spores in biological triplicate growth experiments. Asterisks (*) denote statistical significance between indicated strains by Student’s t-test, P < 0.05. WT; wild-type. The schematic diagram (D) depicts some known cellular functions of yeast HOG1, IRA and ISU. Arrowheads indicate interactions of positive or negative regulation.

