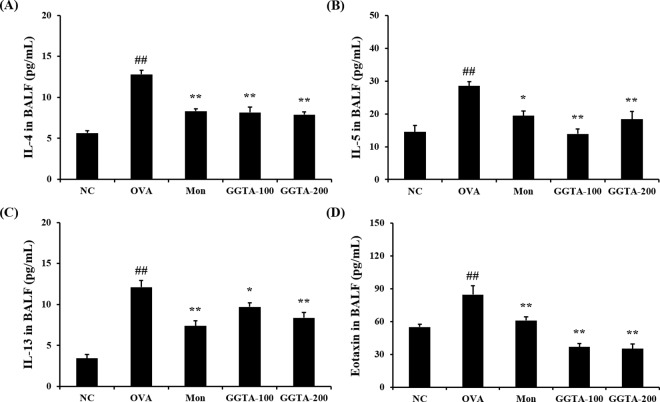
Fig 3. Effect of GGTA on the production of Th2 cytokines and chemokine in the BALF.
Individual data were obtained using ELISA. Th2 cytokines: (A) IL-4, (B) IL-5, and (C) IL-13; chemokine (D) eotaxin. NC, normal-control mice (vehicle group, PBS); OVA, OVA-induced mice (control group); Mon, OVA-induced mice + montelukast (30 mg/kg) (positive-control group); GGTA-100, OVA-induced mice + GGTA (100 mg/kg); GGTA-200, OVA-induced mice + GGTA (200 mg/kg). Values are expressed as means ± SEM (n = 8 per group). Significant differences at ##P < 0.01 compared with the NC group. Significant differences at *P < 0.05 and **P < 0.01 compared with the OVA-induced group, respectively.

