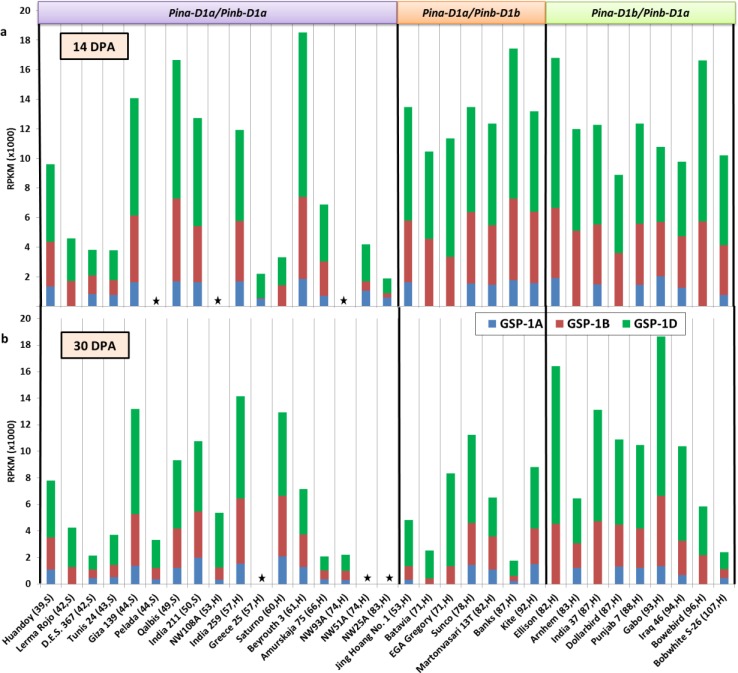
Fig 2. Expression of the GSP-1A, -1B, -1D genes in developing seeds of several wheat genotypes.
a, b gene expression data at 14 and 30 days post anthesis (DPA) respectively; RPKM, reads per kilo base per million mapped reads. Boxes on the top indicate Pin alleles present in the genotypes. Details in brackets after genotype names on the X-axis indicates grain hardness index and endosperm texture of genotypes classified as hard (H) or soft (S) wheats. The asterisk indicates data not available.

