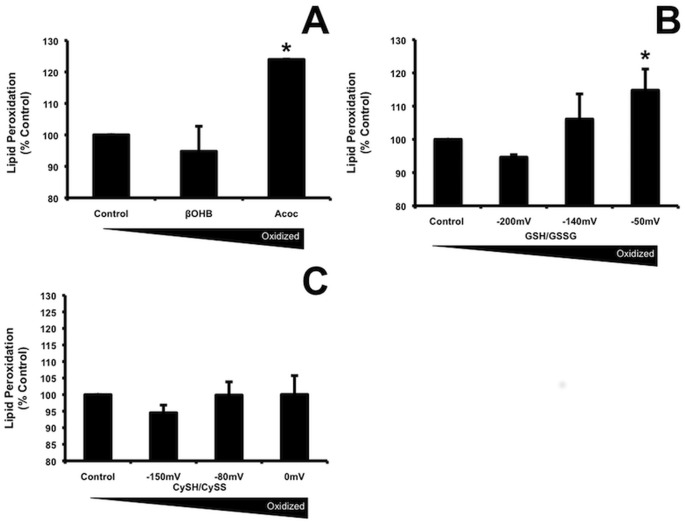
Fig 2. Extracellular oxidation by Acoc and GSH/GSSG but not Cys/CySS increased lipid peroxidation.
LPO was assessed in adipocytes using modified TBARs. Cells were grown and maintained as for ROS measurements. Test compounds were added as in Fig 1 legend, for 90 min (to match the time cells were treated in the ROS production assay). LPO was measured as described in the materials and methods, A) Total concentration of active ßOHB plus Acoc was 20mM, B) GSH plus GSSG 110 μM glutathione (reduced + oxidized glutathione), C) 200 μM cysteine (cysteine + cystine). Data are pooled from 2 separate experiments done in triplicate. Results are expressed as % of reduced form. P = 0.02 comparing Acoc to ßOHB (mean ± SD: 122 ± 1.7%) and p = 0.046 comparing oxidized to reduced glutathione (mean ± SD: 115 ± 6.4%). Fifty μM tert-butyl hydroperoxide (tBH), an inducer of hydrogen peroxide production added as a positive control, increased lipid peroxidation (mean ± SD: 115.7 ± 8.3%) p = 0.03 n = 3 experiments. P-values calculated using ANOVA analysis with a post-hoc Dunnetts.

