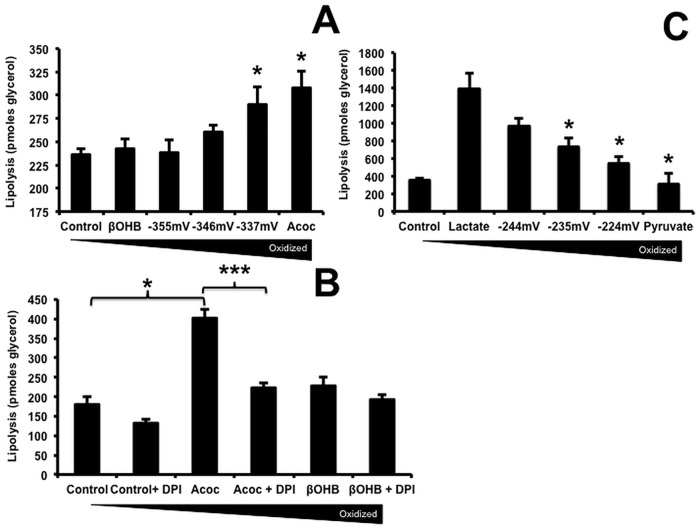
Fig 3. Redox couples altered lipolysis.
Lipolysis was measured as glycerol release [18]. Adipocytes day 14 after differentiation were incubated in KRB with 0.5 mM oleate complexed to 150 μM BSA with or without the test solutions, as in Fig 1 legend, for 4 hours. Forskolin (5 μM) was used as a positive control (not shown). Aliquots were removed and the glycerol content was measured using an NADH-linked assay. DPI was added as an inhibitor of flavin oxidases at 10 μM (B). Data were pooled from 3 independent experiments done in triplicate. Results are expressed as means ± SD. A) Difference between ßOHB and Acoc was significant p = 0.042. C) Pyruvate decreased lipolysis when the L/P ratio was 10:1 p = 0.048, 5:1 p = 0.027 and pyruvate alone p = 0.015. P-values were calculated using ANOVA analysis with a post-hoc Dunnetts test.

