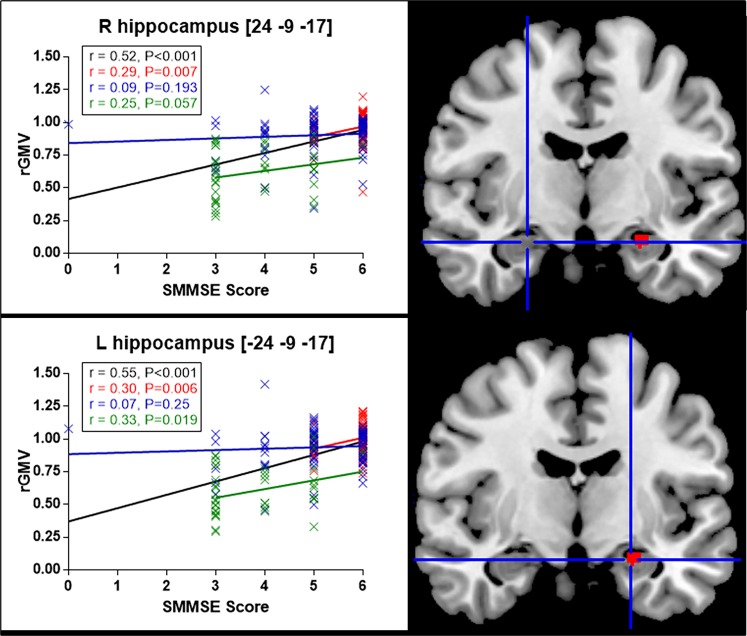
Fig 4. Correlation between the SMMSE score and the regional gray matter volume (rGMV) in right (R) and left (L) hippocampus according to participants’ diagnostic category.
Plots points indicate the quantification of the VBM signal sampled from the voxels of the right and left hippocampus. In black: whole sample of participants; red: cognitively healthy participants; blue: participants with MCI; green: participants with AD. L, left in [x y z], MNI coordinates. Results are shown for P<0.05 corrected for multiple comparisons FWE corrected.

