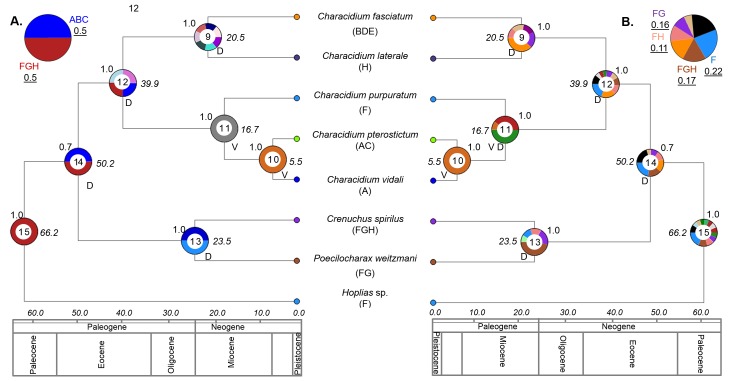
Fig 2. Time-calibrated phylogeny from BEAST analysis and reconstructed ancestral distributions from RASP.
This showing the interrelationship among species of Characidium and their divergence times. Numbers below branches are posterior probabilities obtained in the Bayesian Inference analysis. Each area is marked in colors that are seen in the pie charts node indicating the likelihood of occurrence in an ancient area (the codifications of these areas are in S1 Fig). On top of the pie charts the posterior probability of each tree node. The divergence time values (Mya) are in italics on the left side of the pie. A and B show the detail diagram of the center of origin of Characidium ancestor of the clade and their probabilities underlined. V and D represent vicariance or dispersion in each node.

