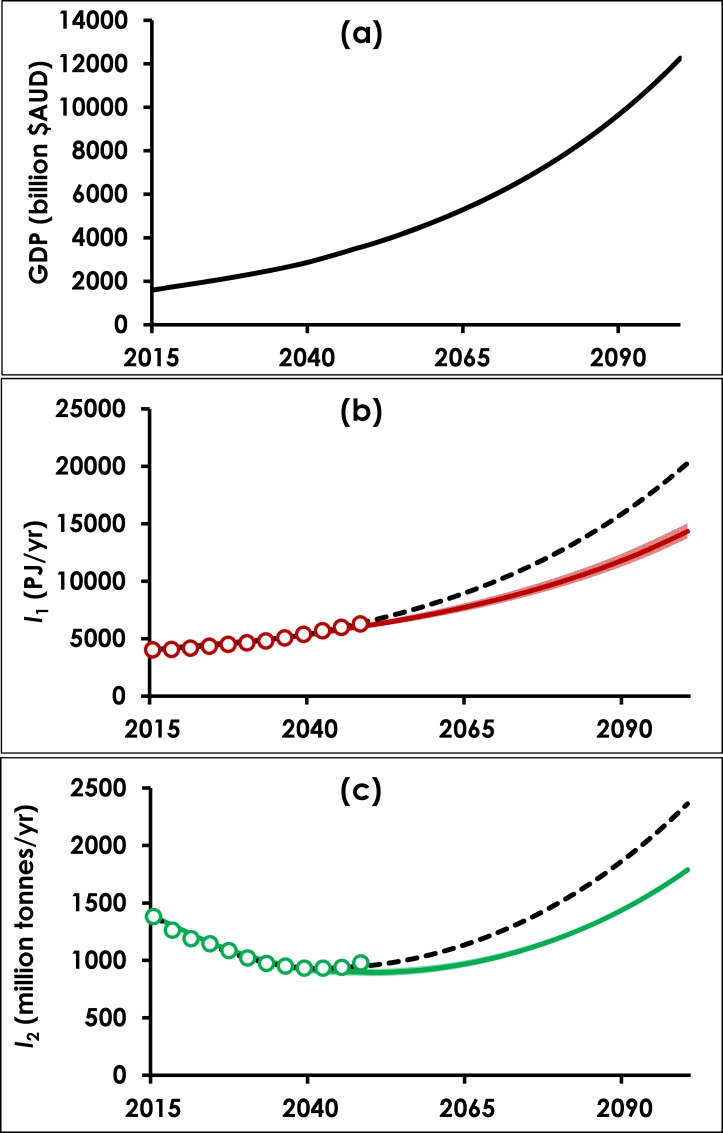
Fig 5.
Projections to 2100 of (a) GDP, (b) final energy demand, and (c) material extractions. Circles represent H-D values for Ij at 3-year intervals, and solid coloured lines represent Ij modelled using Eqs (3) and (5) on a yearly time step, with rj calibrated and Tj,ult set at 0.5Tj(2050). Around each solid line is a coloured band (most visible for (b) energy) representing the 95% confidence interval for rj. Dashed black lines represent modelled Tj when both rj and Tj,ult are calibrated.

