
Fig. 4. Quasi-particle interference and RXS.
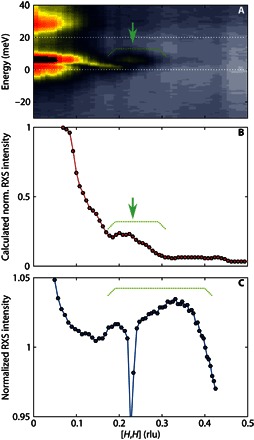
(A) Energy-momentum structure of the quasi-particle band in the [H,H] direction on surface B, with white dashed lines indicating the boundary of the integral (Eq. 1) used to calculate the RXS intensity. (B) Calculated RXS intensity, which exhibits a broad kink starting around H = 0.2 rlu. The momentum range, where the broad peak appears, is indicated by green dashed lines on both (A) and (B). (C) Experimentally measured RXS intensity on CeCoIn5 at T = 22 K, which shows a broad peak around 0.2 < H < 0.4 rlu. The corresponding momentum range is indicated by dashed lines.