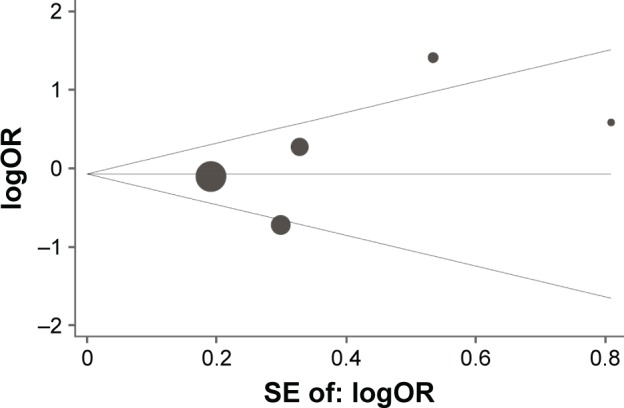
Figure 5.

Begg’s funnel plot with pseudo 95% confidence limits for studies of the association between lung cancer risk and IL-10 -1082A/G (AA vs GG) polymorphism.
Abbreviation: SE, standard error.

Begg’s funnel plot with pseudo 95% confidence limits for studies of the association between lung cancer risk and IL-10 -1082A/G (AA vs GG) polymorphism.
Abbreviation: SE, standard error.