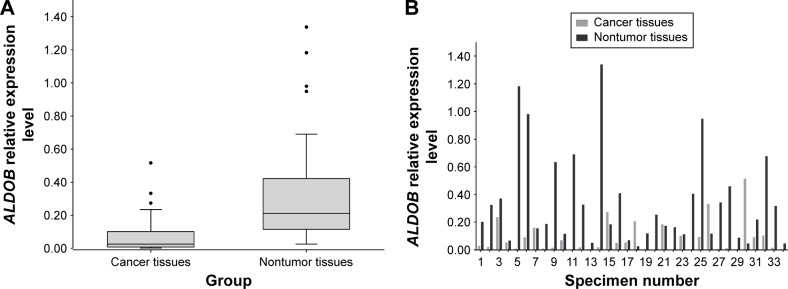
Figure 1.
qRT-PCR results from GC and nontumor tissues.
Notes: (A) The mRNA expression level of ALDOB in GC tissue was much lower than that in nontumor tissue (P<0.001); The Box and Whiskers plot was done via Tukey’s method, in which the upper and lower of endpoints were calculated by 1-5IQR. P-value was derived from Wilcoxon Sign-Rank test. (B) relative mRNA expression levels of ALDOB in 34 paired samples.
Abbreviations: qRT-PCR, quantitative real-time polymerase chain reaction; GC, gastric cancer; mRNA, messenger RNA.

