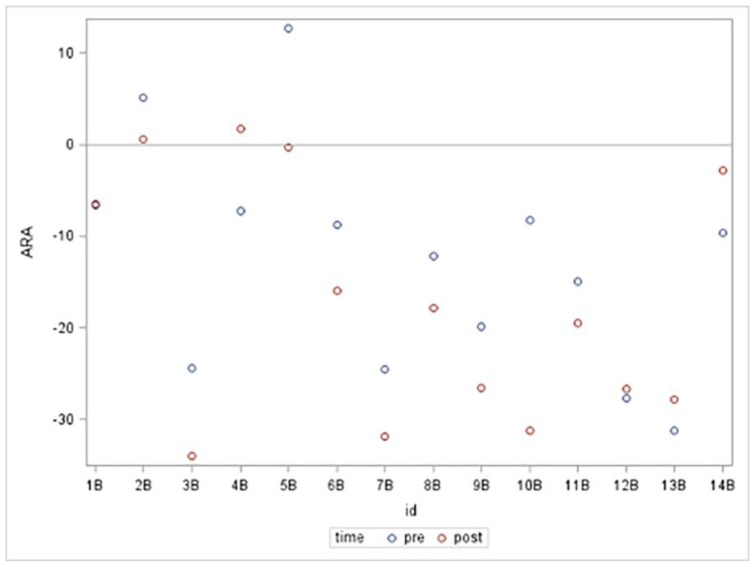
Figure 6.
ARA C2–C7 Pre and Post Anterior Head Flexion
Presented is a scatter plot graph of the ARA C2–C7 for the 14 subjects in the anterior head flexion group. Subjects’ assigned ID numbers are represented on the x-axis and ARA C2–C7 (°) is represented on the y-axis. The blue plots represent the resting NLC ARA C2–C7 values prior to isometric anterior head flexion. The red plots represent the NLC ARA C2–C7 values during a sustained maximum isometric anterior head flexion.

