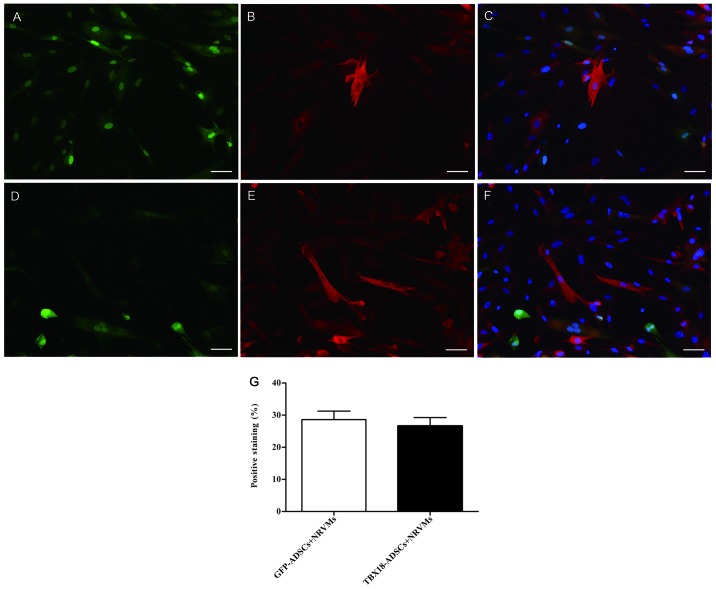
Figure 2.
Expression of cardiac troponin I (cTnI) after co-culture for 7 days. (A) GFP-ADSCs detected by immunofluorescence assay (green). (B) Representative positive staining of cTnI (red). (C) Overlay of images (A and B). The nuclei were counterstained with DAPI (blue). (D) T-box 18 (TBX18)-ADSCs detected by immunofluorescence assay (green). (E) Representative positive staining of cTnI (red). (F) Overlay of images (D and E). The nuclei were counterstained with DAPI (blue). (G) Degree of positive staining of cTnI in TBX18-ADSCs and GFP-ADSCs. Scale bar, 50 µm.

