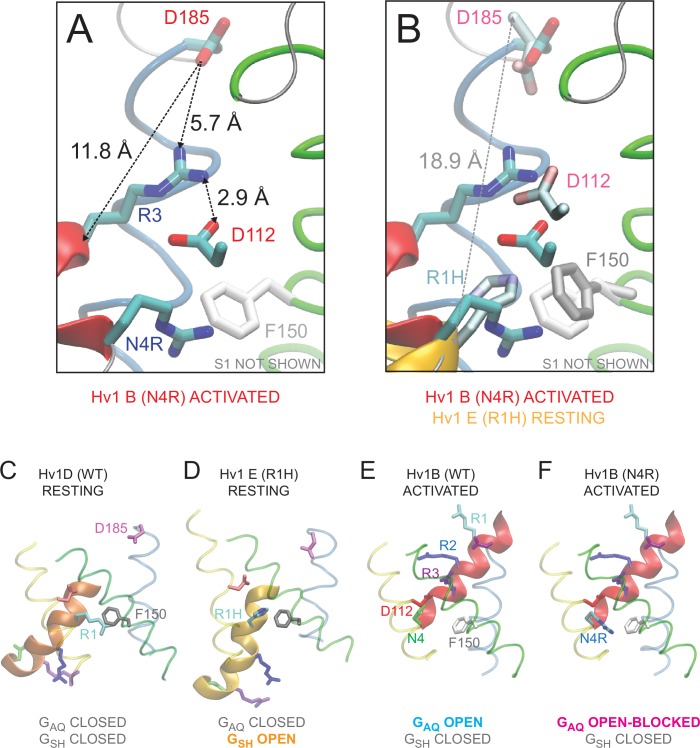
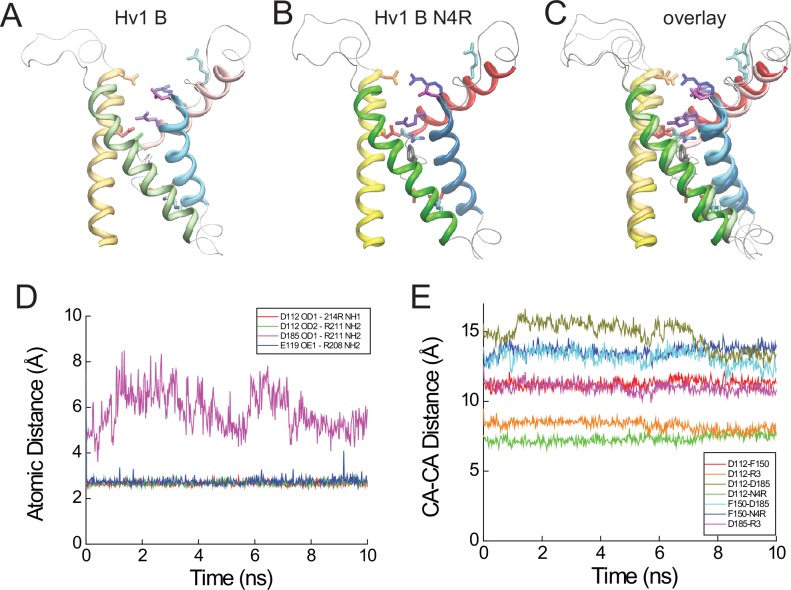
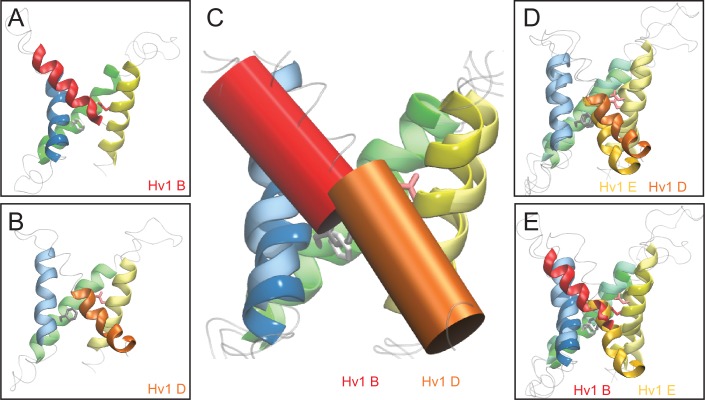
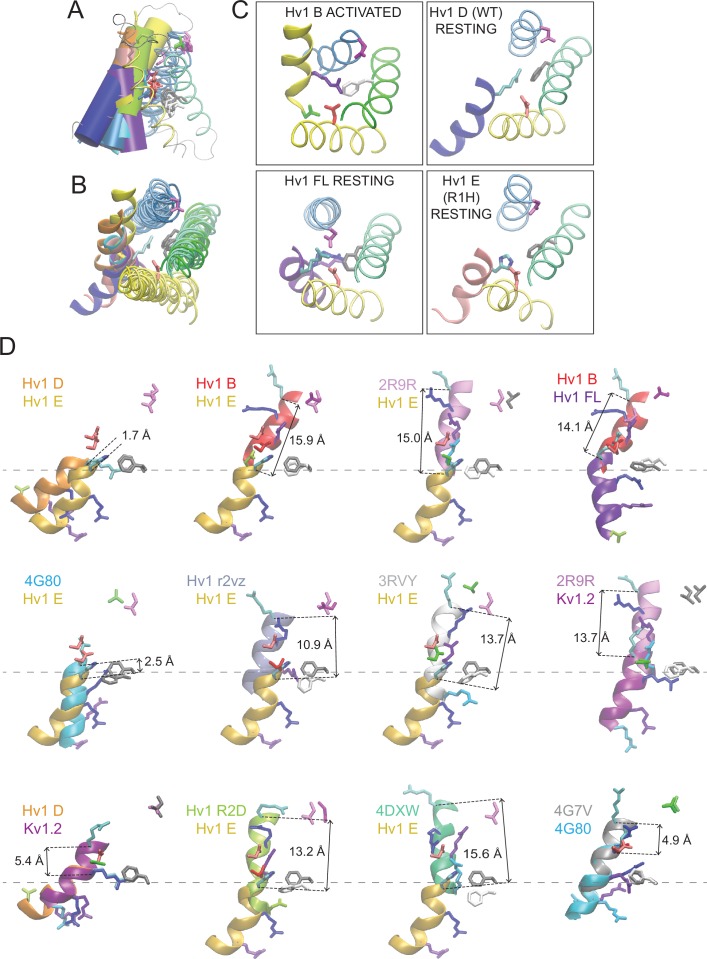
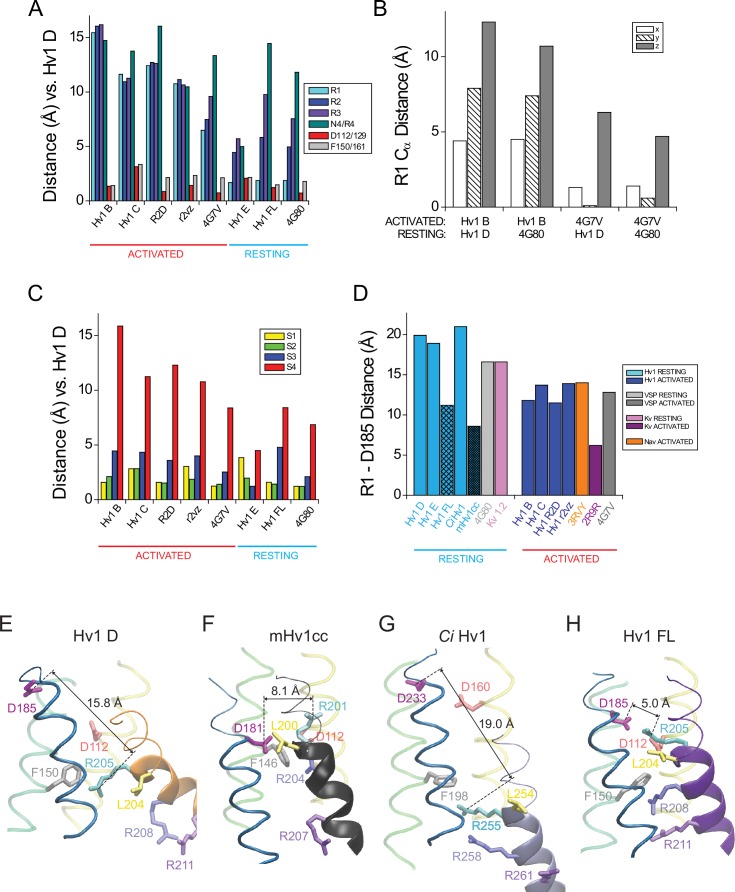
Figure 6. Comparison of resting- and activated-state Hv1 VS domain model structures.
(A) Hv1 B was mutated (N4R) in silico and subjected to energy minimization to demonstrate the possible position of the N4R side chain in a VS-activated (GAQ-blocked) conformation. Other atomic positions are not appreciably different from Hv1 B. S2 (green) and S3 (blue) helices are represented by colored tubes; S4 is shown as a red ribbon and S1 is not shown. Side chains of D112 (D1.51), D185 (D3.61), R3 (R4.53) and N4R (N4.56R) are shown in the colored licorice ‘element’ scheme (carbon, cyan; oxygen, red; nitrogen, blue) and the F150 (F2.50) side chain is white. Distances (in Å) between selected carboxylate oxygen atoms in D112 or D185 and either R3 nitrogen atoms or the R3 Cα atom are indicated by dashed arrows. (B) Positions of selected residue side chains in the Hv1 E mutant model structure (produced by in silico R1H mutation of Hv1 D) are superimposed on Hv1 B N4R shown in A. D112, D185 and R1H side chains are represented by ‘brushed metal’ coloring of licorice element representations; F150 is gray. The S4 helix in Hv1 E is shown as a gold ribbon; other helices are as shown in A. The dashed arrow indicates the distance (in Å) between the Cα atoms of D185 and R1H in Hv1 E. (C–F) Backbones of Hv1 D (C), Hv1 E (D), Hv1 B (E) and the Hv1 B N4R mutant (F) model structures are represented by thin (S1-S3) or thick (S4) colored ribbons and inter-helical loop regions are represented by gray tubes. Selected residue side chains are shown in colored licorice (D112/D1.51, red; F150/F2.50, gray or white; D185/D3.61, magenta; R1/R4.47, cyan; R2/R4.50, blue; R3/R4.53, violet; N4/N214/N4.56, green; N4R, cyan/blue). Structures are vertically aligned by the position of the F150/F2.50 Cα atom. Labels indicate the predicted functional state of the protein that correspond to the depicted structure. In C–F, helices are colored yellow (S1), green (S2) and blue (S3) and inter-helical loop regions are not shown for clarity; S4 residues 202–214 are colored red (Hv1 B), copper (Hv1 D) or gold (Hv1 E). Video 4 shows Hv1 B activated- and Hv1 D resting-state model structures in rotation.

