
Fig. 6.
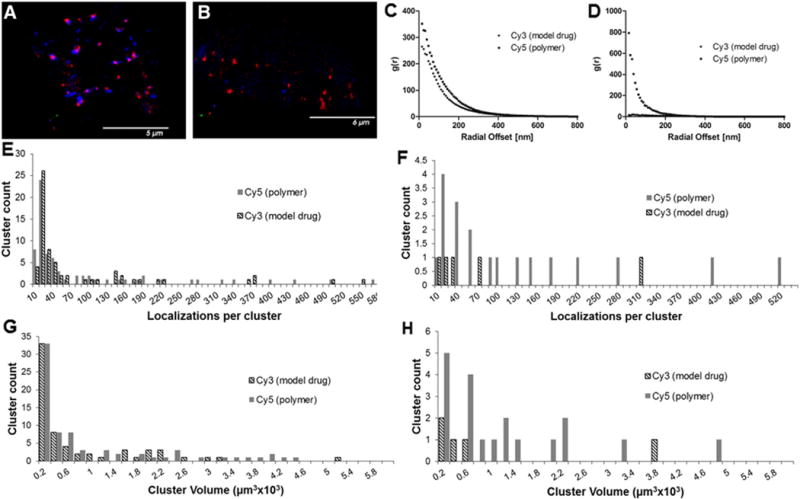
dSTORM images and quantitative analysis of A2780 cells treated with 2P-Cy3–Cy5. A) and B) dSTORM images of single A2780 cells after 4 h and 24 h, respectively (blue = Cy3 (model drug), red = Cy5 (polymer)); C) pair-correlation function (4 h); D) pair-correlation function (24 h); E) histogram of the number of localizations per cluster (4 h); F) histogram of the number of localizations per cluster (24 h); G) histogram of cluster volumes (4 h); H) histogram of cluster volumes (24 h).