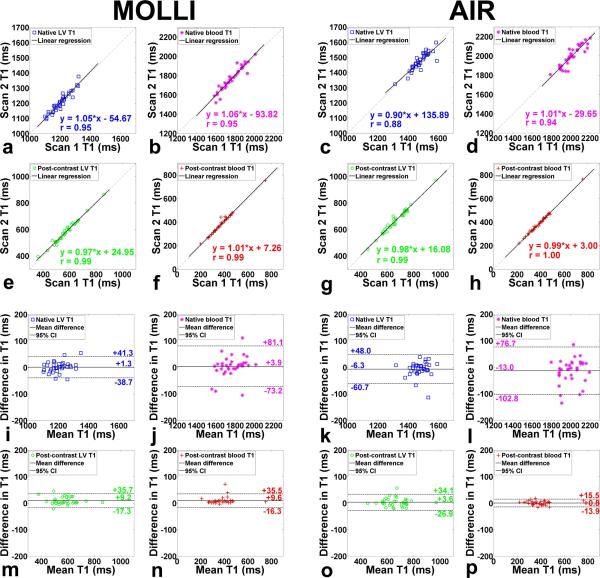
Figure 6.
Linear regression plots (rows 1-2) comparing T1 measurements in four different tissue types between MOLLI scan 1 vs. MOLLI scan 2 (columns 1-2) and AIR scan 1 vs. AIR scan 2 (columns 3-4) . These scatter plots suggest that 3-3-5 MOLLI and optimized AIR produce similar relative intra-scan repeatability. Bland-Altman plots (rows 3-4) comparing T1 measurements in four different tissue types between MOLLI scan 1 vs. MOLLI scan 2 (columns 1-2) and AIR scan 1 vs. AIR scan 2 (columns 3-4). These scatter plots suggest that 3-3-5 MOLLI and optimized AIR produce similar absolute intra-scan repeatability. Four tissue types are: native myocardium (red box) - a, c, i, and k; native blood (purple star) - b, d, j, and l; post-contrast myocardium (green circle) - e, g, m, and o; post-contrast blood (red cross) - f, h, n, and p.

