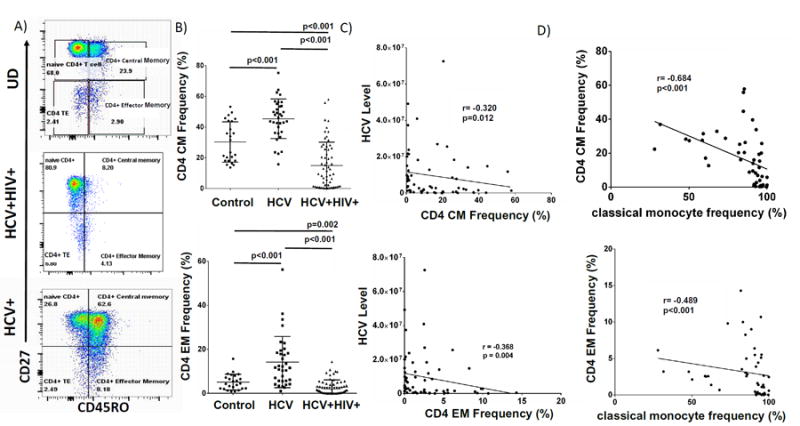
Figure 1. CD4CM and EM Cells are reduced in HCV+HIV+ co-infection and negatively correlate with HCV-level and classical monocyte frequency.

A) Representative CD4 T cell subset gating strategy of cryopreserved PBMC of HCV+HIV+co-infected, HCV-infected and uninfected subjects (controls) which were stained with Yellow Live/Dead stain (Invitrogen, Grand Island, New York), anti-CD3-AlexaFluor700 (clone UCHT1), anti-CD14-Alexaflour700 (M5E2), anti-CD16-APC-H7 (3G8), anti-CD4-PE (RPA-T4), anti-CD8-PerCP (53-6.7), anti-CD27-PE-Cy7(M-T271), anti-CD45RO-FITC (UCHL1), anti-CD86-PE-Cy7 (IT2.2) or isotype controls. Flow cytometry data were acquired on a BD LSRII flow cytometer (BD Biosciences), and analyzed using FlowJo (TreeStar). Live cells were identified by forward and side scatter and viability. B) Week 0 CD4+CM and CD4+EM T cell frequencies (%) of each group. C) Baseline (Week 0) CD4 CM (top) and EM (bottom) frequencies of HCV+HIV+co-infected participants in relation to HCV level in absence of exogenous IFN. D) Week 0 classical monocyte (CD14brightCD16-) frequency (%) of HCV+HIV+co-infected participants (n=49) in relation to CD4 CM and EM frequencies.
