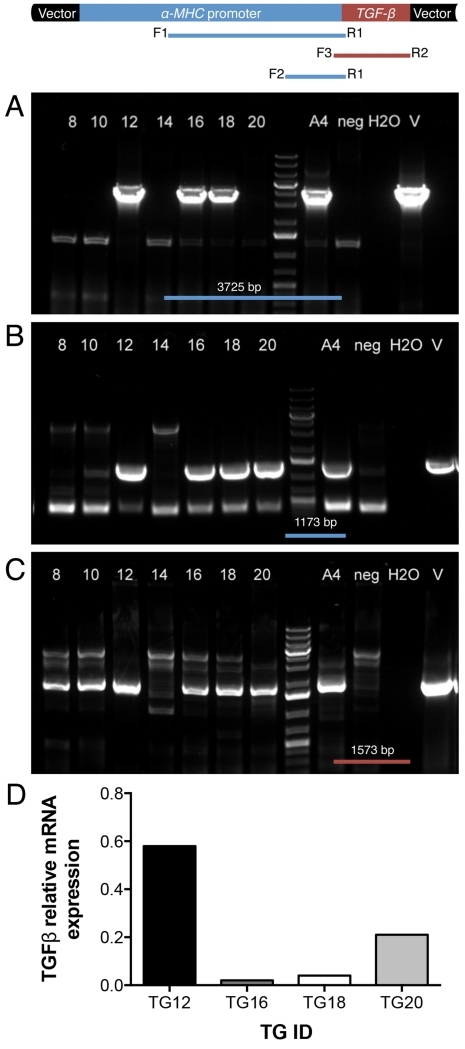
Figure 2.
A-C. PCR analysis of cloned goats. The vector cartoon is depicted above the panels. (A) PCR results for a 3725 bp α-MHC fragment using primers F1 and R1, (B) PCR results for a 1173 bp α-MHC fragment using primers F2 and R1, and (C) PCR results for a 1573 bp hTGF-β1 fragment using primers F3 and R2. Lanes 8, 10, 12, 14, 16, 18 and 20 = cloned goats; A4 = positive control (cells); H2O = water only (non-template control); neg = wild-type goat genomic DNA; V = vector. D. hTGFB mRNA levels in RV biopsies of four transgenic goats (TGs) shown as the percentage of expression relative to housekeeping genes: Beta-actin, YWHAZ, EIF4A, and GAPDH.

