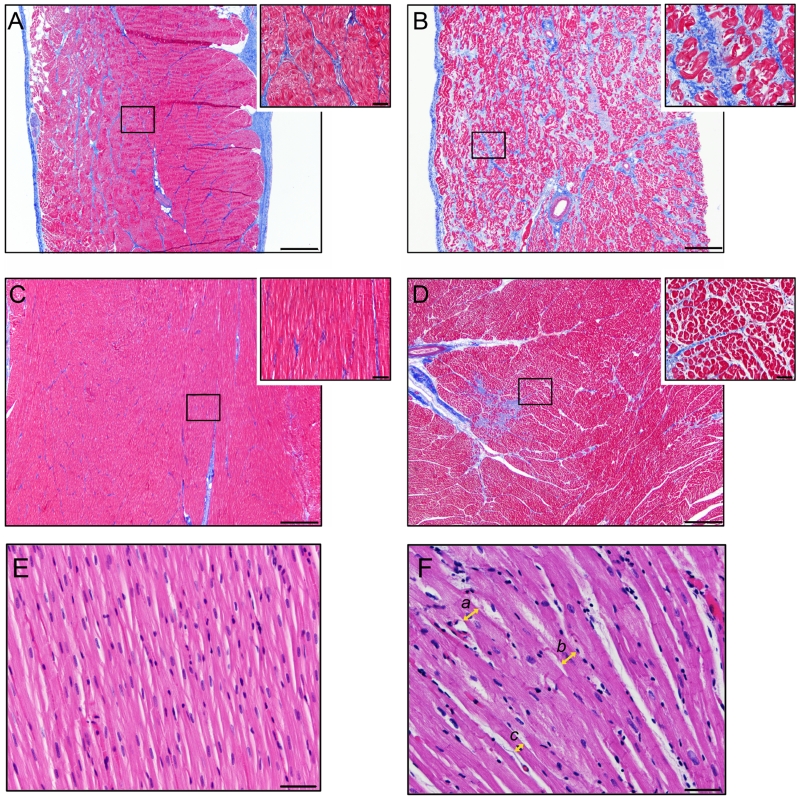
Figure 5.
Examples of histopathology of wild-type (Wt) and TFG-β1cys33ser transgenic goat (TG) hearts. A-D. Masson trichrome stain. (A) Section of the left atrium (LA) of Wt heart. Note the small amount of collagenous stroma (blue staining) present in the endo and perimysium surrounding the myocytes (red staining). (B) Section of the LA of a TG. Note the diffusely increased amount of collagenous stroma present in the endo and perimysium compared to the control goat in A. (C) Section of the left ventricle (LV) of the same Wt heart as in A. (D) Section of the LV from the same TG heart as in B. Note the focal area with increased amount of collagenous stroma present in the endo and perimysium compared to the control goat in C. 40× Scale bar =500 μm. Inserts: 400× Scale bar =50 μm. E-F. Hematoxylin and eosin stain. Histopathology of the left atrium of a Wt control goat (E) and TFG-β1cys33ser transgenic goat (F). TG histopathology in F demonstrating myofiber hypertrophy and how the measurements of the myofiber diameter were made. Hypertrophied myofibers (a = 25.01 μm) and (b = 24.10 μm) are present in the center and right side of the image, while myofiber with a smaller diameter (c = 13.81 μm) similar to control animals are present in the left lower corner of the image. Myofiber diameters were measured at the narrowest plane across the nucleus. 400× Scale bar =50 μm.

