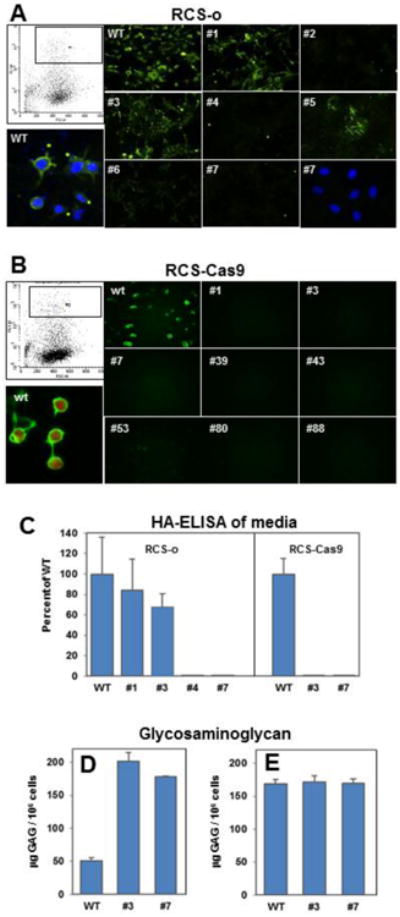
Fig. 1. Selection and screening of transfected RCS cells for Has2 knockout clones.

Panel A: Representative flow cytometric cell sorting of RCS-o transfected chondrocytes to select GFP+ cell is shown in upper left. WT RCS-o and GFP+ cloned RCS cells were stained with b-HABP to detect cell surface associated HA; individual clone numbers are indicated. WT RCS-o cells with DAPI counterstain and positive HABP staining for cell surface HA is shown in lower left. Clone #2, #4 and #7 are negative for HABP staining; lower right panel shows DAPI staining of the same field of Clone #7 cells. Panel B: Representative flow cytometric cell sorting of RCS-Cas9 transfected chondrocytes to select GFP+ cell is shown in upper left. WT RCS-Cas9 and GFP+ cloned RCS cells were stained with b-HABP to detect cell surface associated HA; individual clone numbers are indicated. WT RCS-Cas9 cells show positive HABP staining for cell surface HA and mCherry fluorescence is shown in lower left. Panels A and B show representative images from 3 independent experiments. Panel C. Media from the cultures of WT and Has2 KO clones was analyzed by HA ELISA. Values represent the percent of the mean value for WT RCS-o or WT RCS-Cas9 detected in the media of the numbered clones from two independent experiments. Panel D: Release of sGAG by RCS-Cas9 WT and Has2 KO clones into the conditioned media was determined by the DMMB assay. Values represent the mean μg GAG per 106 cells from two independent experiments. Panel E: Total sGAG in the cultures is presented as the sum of sGAG in the conditioned media + obtained from the cell layer of RCS-Cas9 WT and Has2 KO clones by trypsin treatment. Values represent the mean μg GAG per 106 cells from two independent experiments.
