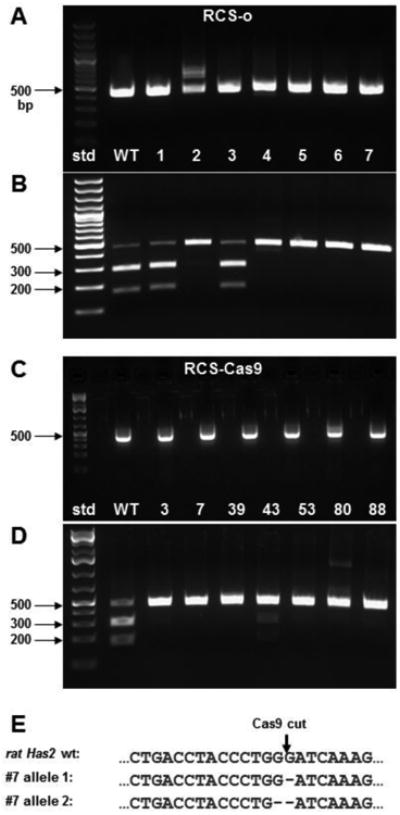
Fig. 2. Detection and determination of Has2 gene mutation.

A 454 bp region within exon2 of rat Has2 that contains the Cas9 mutation site was PCR amplified from genomic DNA of each cell clone as a template. The amplified product was gel-purified and then digested with Pas1. The final products were analyzed by agarose gel electrophoresis. DNA standards (std) are labeled. Panel A. Products amplified from RCS-o WT cells and clones 1 thru 7. Panel B. Pas1 digestion products of the amplified 454 bp products shown in panel A. Panel C. Products amplified from RCS-Cas9 WT cells and clones 3, 7, 39, 43, 53, 80 and 88. Panel D. Pas1 digestion products of the amplified 454 bp products shown in panel C. Panel E. Alignment of the targeted rat Has2 genomic sequences from RCS-Cas9 clone #7, allele 1 and allele 2 with the WT RCS-Cas9 cells. Deleted bases are indicated.
