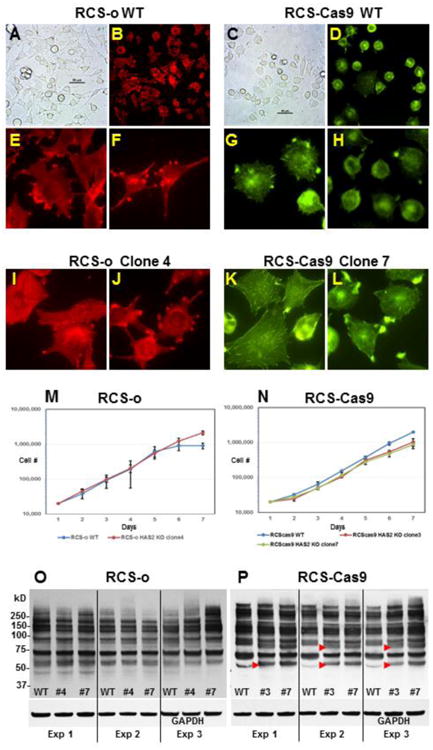
Fig. 3. Initial characterization of WT and Has2 knockout clones.

Panels A and C: Phase contrast microscopy of RCS-o WT and RCS-Cas9 WT cells. Panels B, E, F: TRITC-phalloidin staining of RCS-o WT cells. Panels D, G, H: Fluorescein phalloidin staining of RCS-Cas9 WT cells. Panels B and D represent lower power view of phalloidin-stained cells. Panels I and J: TRITC-phalloidin staining of RCS-o Clone #4 cells that lack cell surface HA. Panels K and L: Fluorescein phalloidin staining of RCS-Cas9 clone #7 cells with mutated Has2 alleles. Panel M: Growth curves for RCS-o WT and RCS-o Has2 KO clone #4 cells plotted on a log scale showing the mean value from 2 independent experiments. Panel N: Growth curves for RCS-Cas9 WT, and RCS-Cas9 Has2 KO clone #3 and clone #7 plotted on a log scale showing the mean value from 3 independent experiments. Panels O and P: Representative western blots using the RL2 antibody to detect GlcNAcylated proteins expressed in WT and Has2 KO clones of RCS-o or RCS-Cas9 cells as labeled, from three independent experiments. Red arrowheads indicate bands with changes in intensity.
