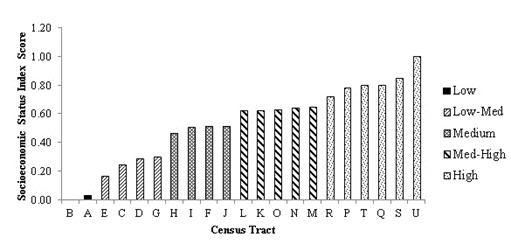
Figure 2.

Socioeconomic status index distribution produced from the 2006 Census Profile and 2005 taxfiler datasets for the census metropolitan area of Guelph using all principal components with eigenvalues greater than 1.0 and that represent more than 10% of the variation.
