
Figure 6.
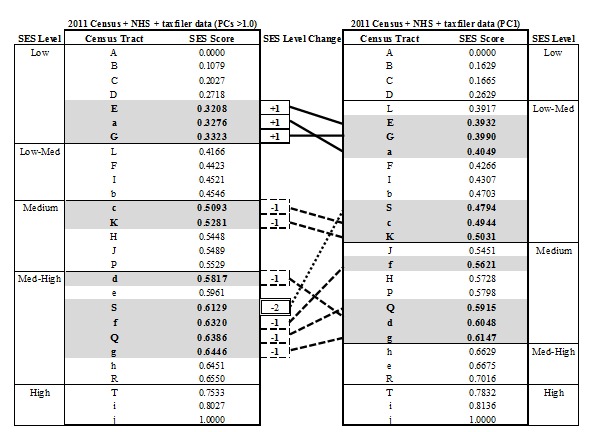
Socioeconomic status scores for the census metropolitan area of Guelph produced from a combination of the three 2011 datasets using all principal components with eigenvalues greater than 1.0 and a proportion of explained variance greater than 10% (‘PCs >1.0’) versus using only the first principal component (‘PC1’).