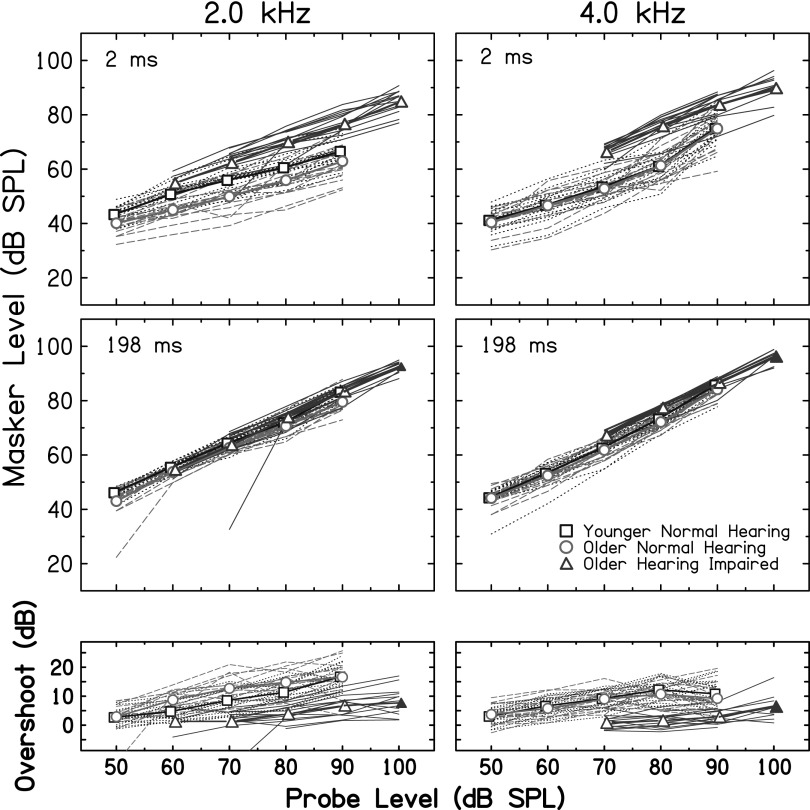
FIG. 3.
(Color online) Masking thresholds and overshoot. Top and middle panels are masking thresholds for 2− and 198-ms probe delays, respectively. The bottom panels display overshoot, calculated by subtracting the 2-ms thresholds from the 198-ms thresholds. The left and right columns are data for the 2- and 4-kHz probes, respectively. The interpretation of lines is as in Fig. 1. The filled symbols at 100 dB SPL indicate that these thresholds were extrapolated for some OHI subjects due to thresholds being beyond the limits of the equipment.

