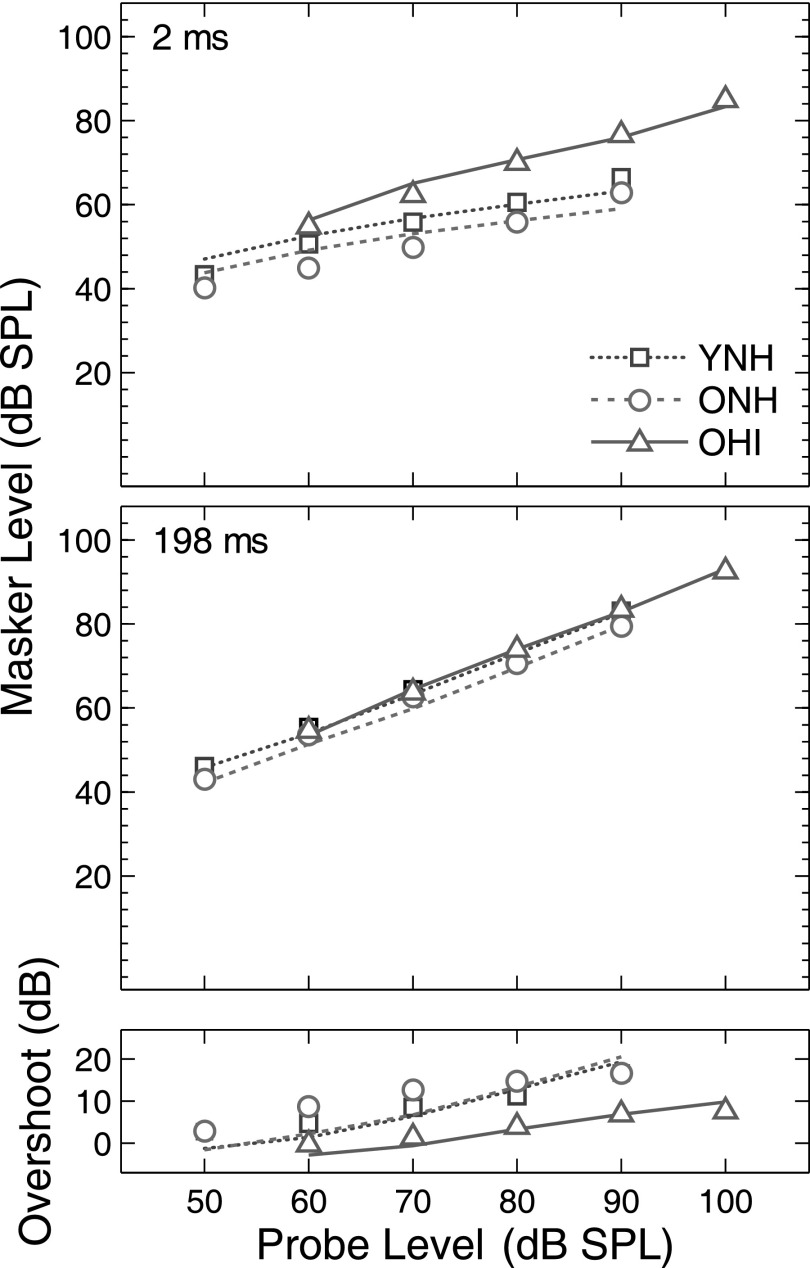
FIG. 5.
(Color online) Predicted masking thresholds (lines) in overshoot conditions for the average behavioral data (symbols) obtained with a 2-kHz probe. Top and middle panels show predictions and measured data in the 2− and 198-ms delay conditions. The bottom panels display overshoot, calculated by subtracting the 2-ms thresholds from the 198-ms thresholds.

