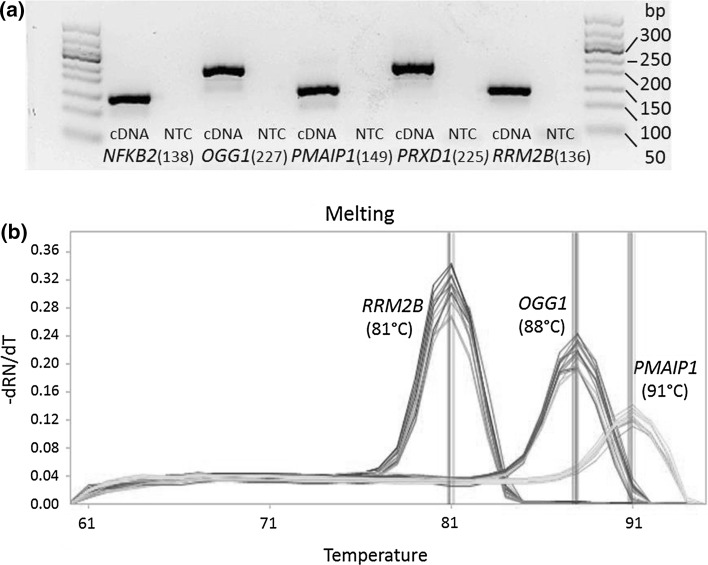
Fig. 1.
Evaluation of primer specificity. a Example of agarose gel electrophoresis analyses for the genes NFKB2, OGG1, PMAIP1, PRDX1 and RRM2B (and included NTCs) with corresponding size of the specific target amplicons. b Example of melting curve analyses (BioMark™ HD System) for the genes OGG1, PMAIP1 and RRM2B with corresponding melting temperatures of the specific target amplicons

