
Fig. 3.
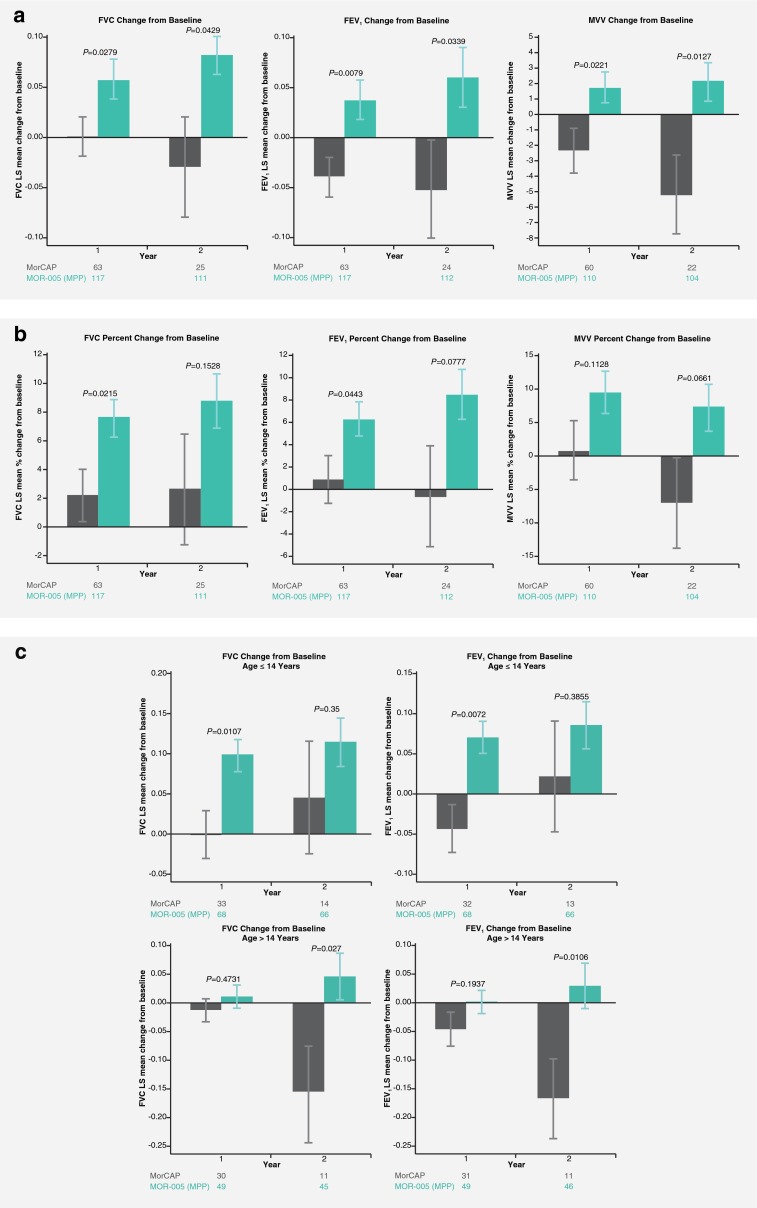
Least square (LS) mean respiratory function changes from MOR-004 baseline in the MOR-005 modified per-protocol (MPP; green bars) population treated with elosulfase alfa versus corresponding untreated patients from the MorCAP (gray bars) natural history study (ANCOVA analysis). a FVC, FEV1, and MVV LS mean change from baseline b FVC, FEV1, and MVV LS mean percent change from baseline c FVC and FEV1 LS mean change from baseline in patients aged ≤14 years and >14 years. Error bars represent standard error; Ns are shown at the bottom of each graph