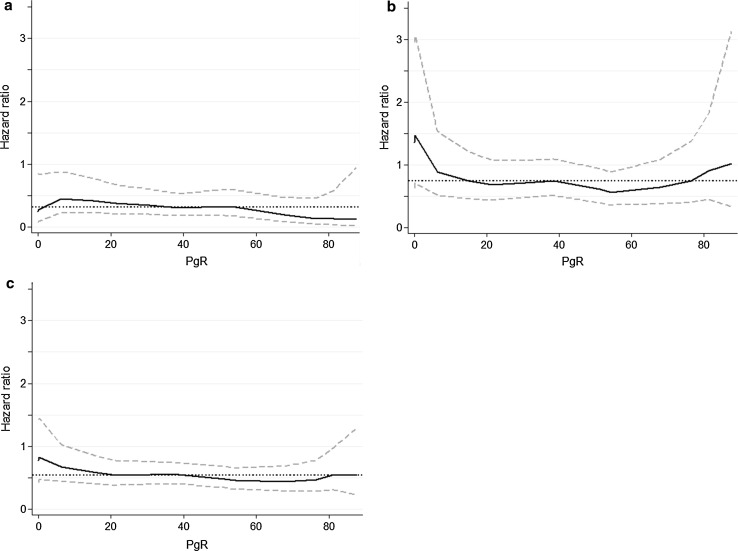
Fig. 4.
Subpopulation treatment effect pattern plots (STEPP), showing the effect of tamoxifen vs. no tamoxifen on the recurrence risk during the first 5 years after diagnosis (a), more than 5 years after diagnosis (b) and over the whole time period (c) in relation to PgR values measured with IHC. HR (solid black line) with the corresponding 95 % confidence interval (dashed gray lines) is plotted against the mean PgR. The dotted black line shows the HR for tamoxifen vs. control for all PgR values in the selected time period. The analysis was confined to patients with ER-positive tumors

