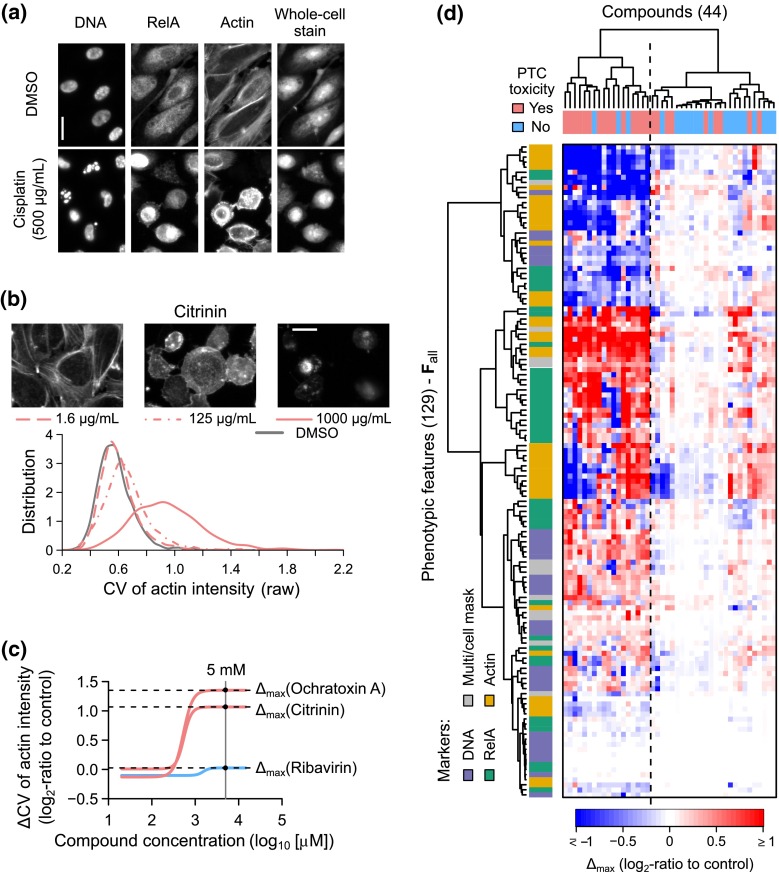
Fig. 2.
Quantitative image-based phenotypic profiles of primary human proximal tubule cells treated with the reference compounds. a Immunofluorescence images showing the four fluorescence markers used in the HPTC-A dataset for primary PTCs treated with the DMSO control or 500 µg/mL cisplatin (scale bar 20 µm). b Single-cell probability distribution functions for the raw coefficient of variation (CV) of actin intensity values measured from primary PTCs treated with different concentrations of citrinin (light red lines) or DMSO (gray line). Exemplary fluorescent images for the actin stains are shown above the distribution function plots (scale bar 20 µm). c Concentration response curves for changes in the CV of actin intensity induced by three of the reference compounds (light red = PTC-toxic compounds, light blue = non-PTC-toxic compound). The maximum response value () for each compound was determined from its response curve at 5 mM. d Heatmap showing the values for all the 129 phenotypic features (rows) measured from primary human PTCs treated with 44 reference compounds (columns). (Dendrograms = hierarchical clustering of the compounds or features based on the values, dash line = separation between the two major clusters identified from the clustering of compounds)

