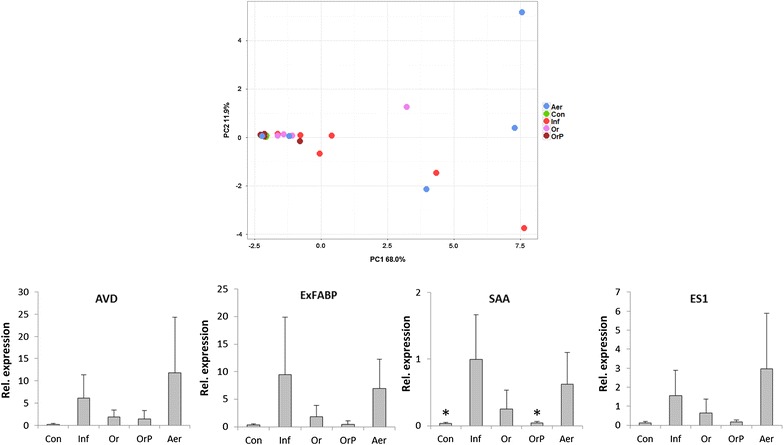
Figure 5.

Gene expression in the chicken in cecal tissue following vaccination and oral challenge. Upper panel, Principal Component Analysis (PCA) of individual chickens using “integrated” expression of 16 genes used for the characterization of chicken response to S. Enteritidis challenge. The chickens vaccinated by aerosol responded to the infection similarly as the non-vaccinated chickens indicating the lowest protection. On the other hand, orally vaccinated chickens clustered with the non-infected controls showing the highest protective effect of oral vaccination. Con: control, non-vaccinated and non-infected chickens, Inf: non-vaccinated but infected chickens, Or: orally vaccinated and infected chickens, OrP: orally vaccinated together with administration of cecal microbiota (probiotics) and infected chickens, Aer: aerosol vaccinated and infected chickens. Lower row of four panels, average expression of four genes with the highest expression in the chicken cecum following oral infection with S. Enteritidis. AVD: avidin, ExFABP: extracellular fatty acid binding protein, SAA: serum amyloid A, ES1: ES1 protein homolog, mitochondrial-like. For the expression of all individual genes, see Additional file 1. * significantly different from non-vaccinated chickens but infected chickens by ANOVA at P < 0.05.
