FIGURE 2.
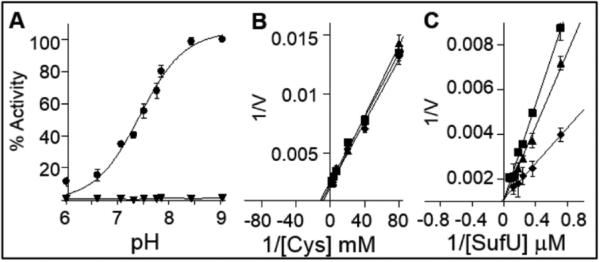
pH-activity profile of SufS reaction. A) The pH dependency of SufS reaction in the absence (▼) and in the presence of SufU (●). The data was fitted to the Henderson-Hasselbalch equation, , where Act is the relative activity (%) at each pH value in relation to the maximum activity determined at pH 8. The pKa of this ionization event was calculated to be 7.34. B) Double reciprocal plots of alanine formation under steady state conditions of cysteine substrate saturation curve. Reactions were carried out in the presence of 1.3 μM SufS, 39 μM SufU and variable concentrations of L-cysteine (0.0125 – 0.5 mM). C) Double reciprocal plots of alanine formation under steady state condition of SufU substrate saturation curve. Reactions were carried out in the presence of 1.3 μM SufS 0.5 mM L-cysteine, and variable concentration of SufU (1.3 – 13 μM). All reactions were performed in panel B and C were at pH 7.4 (■), pH 7.7 (▲) and pH 8.1 (◆).

