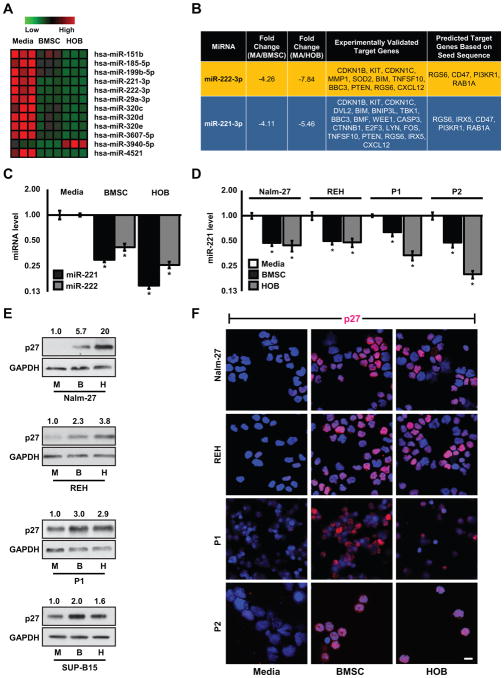
Figure 2.
ALL cells have miRNA alterations when influenced by the BMM. A, The heat map represents miRNA microarray data comparing SUP-B15 ALL cells co-cultured with BMSC or HOB to those grown in media only. B, The table represents miR-221 and miR-222 relative fold changes from the microarray along with experimentally validated target genes taken from TarBase (29) and predicted target genes taken from TargetScan (28). C, qRT-PCR validating miRNA microarray data measuring fold change of miR-221 and miR-222 in SUP-B15 ALL cells from the same conditions as A. D, qRT-PCR of mature miR-221 fold change in Nalm-27, REH, and 2 patient derived leukemic samples co-cultured with BMSC or HOB compared to those grown in media only. E, Western blots and F, immunofluorescence images of p27 abundance in Nalm-27, REH, and patient derived leukemic samples (due to lack of adequate sample, western blot analysis was unable to be performed for P2). Western blot values depict fold change relative to media only controls and normalized to housekeeping gene GAPDH. Error bars represent standard deviation of the mean with samples performed in triplicate. *, P < 0.05. Scale bars, 10 μm. P1, patient sample 1; P2, patient sample 2.

