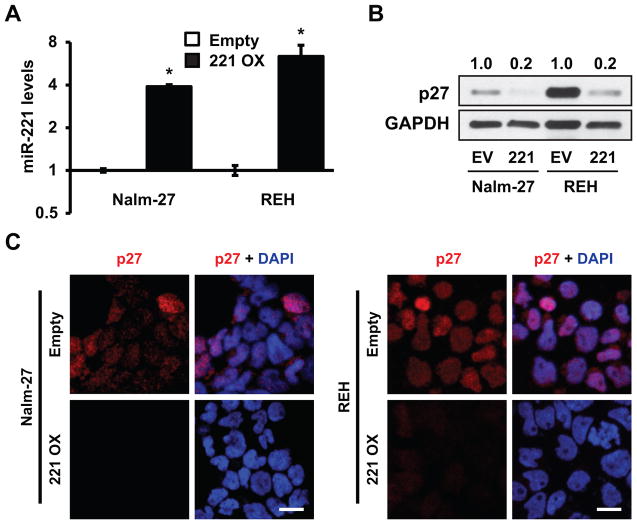
Figure 4.
Overexpressing miR-221 reduces p27 abundance in ALL. A, qRT-PCR of miR-221 fold change in Nalm-27 and REH cells overexpressing miR-221 compared to empty vector control. B, Western blot analysis of p27 abundance in Nalm-27 and REH cells overexpressing miR-221 or empty vector control. Values depict fold change relative empty vector control and normalized to housekeeping gene GAPDH. C, Immunofluorescent images of p27 expression under the same conditions as B. Error bars represent standard deviation of the mean with samples performed in triplicate. *, P < 0.05. Western blot, immunofluorescent images and bar graphs are representative data from 3 independent experiments. Scale bars, 10 μm. EV, empty vector; 221/221 OX, miR-221 overexpression.

