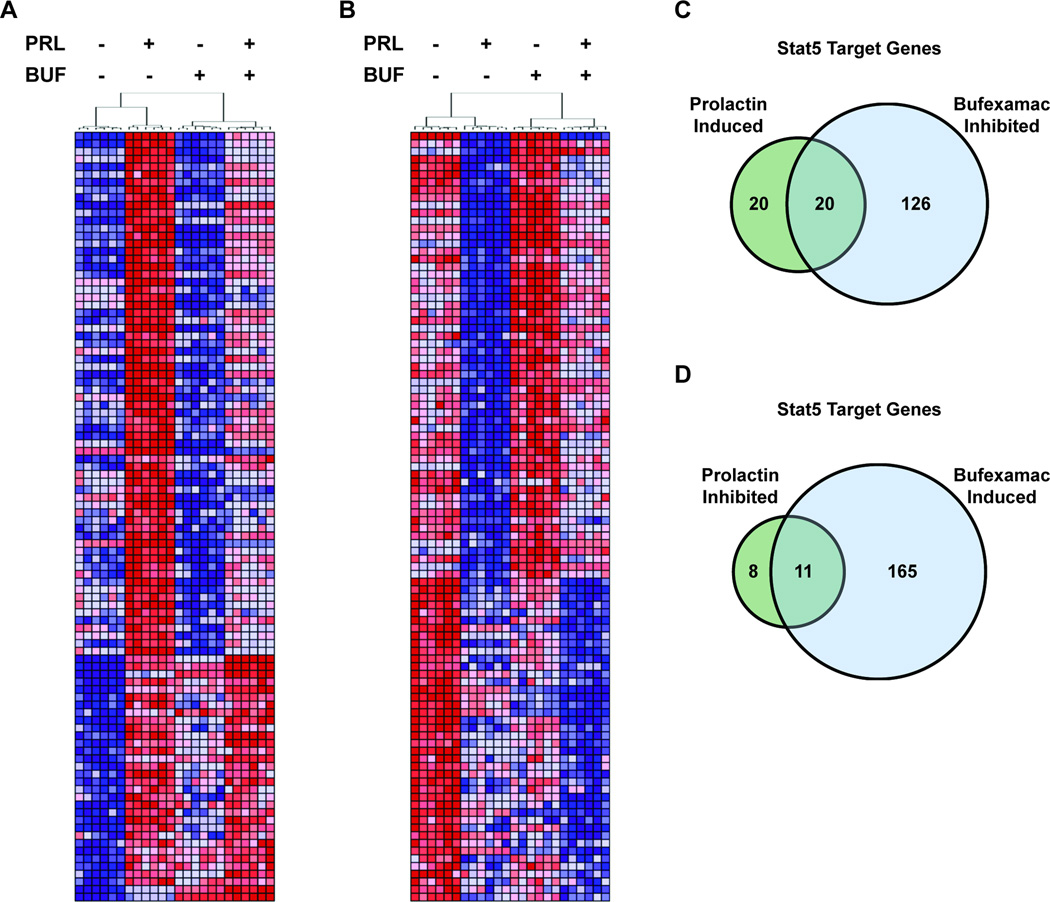
Figure 4. Bufexamac opposes prolactin induced gene expression globally and at STAT5 target genes.
(A, B) Heat maps depict expression values of the top 100 prolactin induced (A) and prolactin inhibited (B) genes (represented by rows) identified by microarray analysis. Samples are represented by columns and are ordered as determined by hierarchical clustering. Samples clustered with technical and biological replicates according to the treatment conditions indicated above each dendrogram (PRL; prolactin, BUF; Bufexamac). Red and blue represent high and low gene expression, respectively. (C, D) Venn diagrams quantify the STAT5 target genes* from the microarray analysis that are significantly prolactin induced (C) or prolactin inhibited (D) with fold change >1.2 that are also significantly inhibited (C) or induced (D) by Bufexamac. *Genes identified as Stat5 target genes are defined as those previously reported by Kang et al. (see Materials and Methods).

