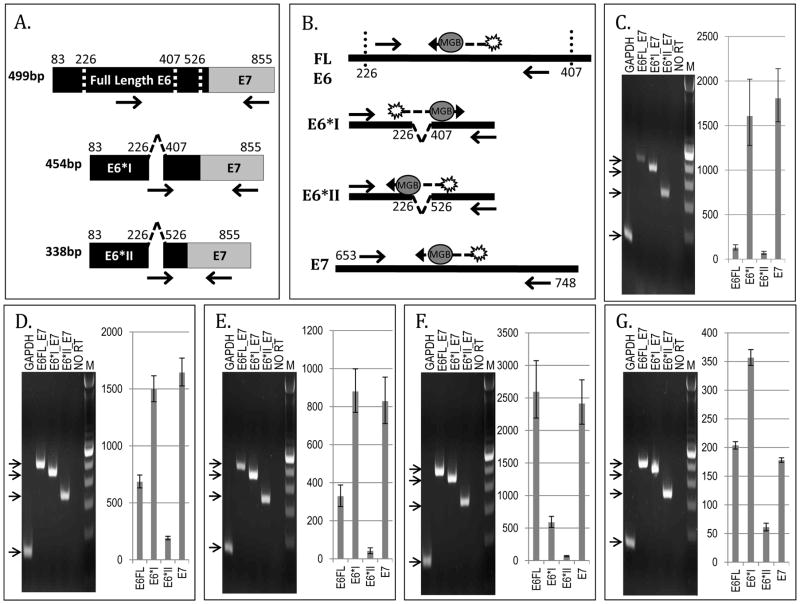
Figure 1.
HPV Oncogene Transcript-Specific Quantitative RT-PCR and E6–E7 RT-PCR in HPV16-Positive Responsive Tumors. Bar graphs represent TaqMan quantitative PCR relative expression, and electrophoretic gel images represent E6–E7 RT-PCR. Panel A. RT-PCR Strategy for Transcript-Specific E6–E7 Oncogene Evaluation. Panel B. TaqMan Quantitative RT-PCR Strategy for Transcript-Specific E6 Oncogene Evaluation. Primers within the spice region or across splice junctions allow for exclusive amplification of full length E6 or alternate E6 transcripts. Panel C. 1733, Panel D. 1769, Panel E. 1804, Panel F. 1971, Panel G. 2148. Arrows indicate sizes of expected amplicon bands: HPVE6 FullLength_E7=499bp, HPVE6*I_E7= 454bp, and HPVE6*II_E7= 338bp. NO RT=no reverse transcriptase negative control. M= 100bp ladder.

