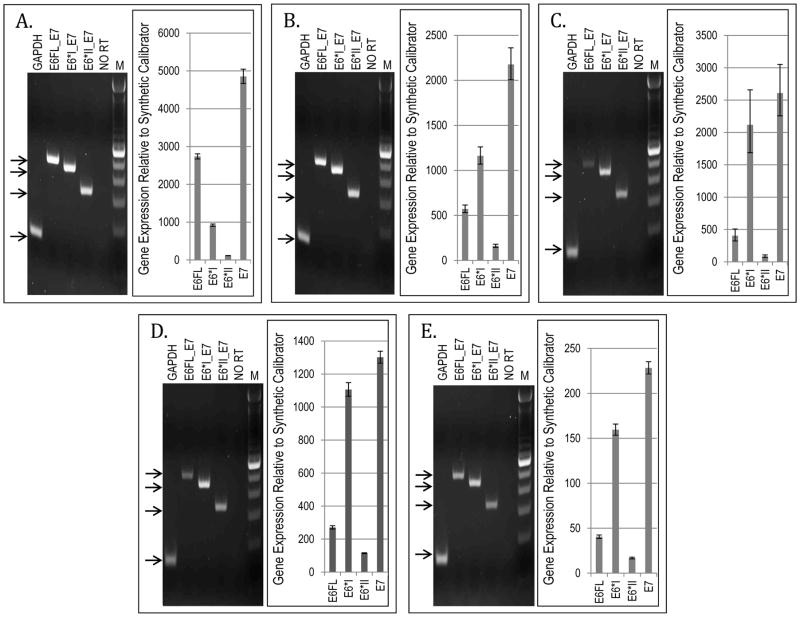
Figure 2.
HPV Oncogene Transcript-Specific Quantitative RT-PCR and E6–E7 RT-PCR in HPV16-Positive Recurrent Tumors. Bar graphs represent TaqMan quantitative PCR relative expression, and electrophoretic gel images represent E6–E7 RT-PCR. Panel A. 0732, Panel B. 0843, Panel C. 1040, Panel D. 2049, Panel E. 2238. Arrows indicate sizes of expected amplicon bands: HPVE6 FullLength_E7=499bp, HPVE6*I_E7= 454bp, and HPVE6*II_E7= 338bp. NO RT=no reverse transcriptase negative control. M= 100bp ladder.

