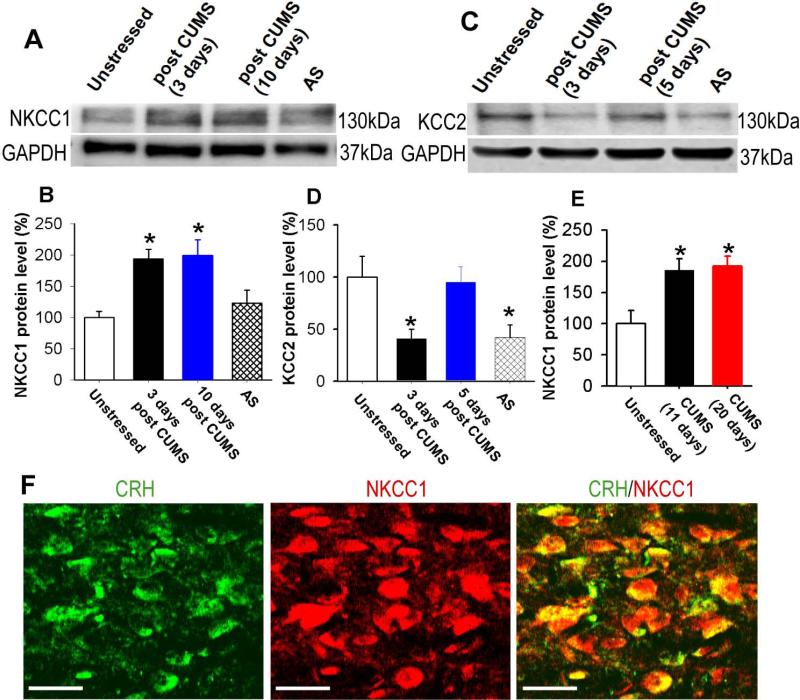
Figure 5. Chronic stress upregulates NKCC1 in the PVN.
(A and B): Immunoblots (A) and quantification (B) of NKCC1 protein levels in the PVN tissue in unstressed, 3 days and 10 days after completion of CUMS treatment, and 2-h acute restraint stress (AS) rats (n = 4 samples in each group). The molecular weight is indicated to the right of the gel images. C and D: Immunoblots (C) and quantification (D) of KCC2 protein levels in the PVN in unstressed rats and 3 days and 10 days after completion of CUMS treatment, and 2-h acute restraint stress (AS) rats (n = 4 samples in each group). The molecular weight is indicated to the right of the gel images. (E): NKCC1 expression levels in the PVN in unstressed, 11-day CUMS, and 20-day CUMS rats. NKCC1 levels were measured 5 days after completion of CUMS treatment. (F): Confocal images depicting the presence of NKCC1 (red) on CRH-expressing neurons (green). All images are single confocal optical sections. Scale bars indicate 20 μm. * P < 0.05 compared with the value in unstressed rats, repeated-measures ANOVA with Dunnett's post hoc test. AS: 2-h acute restraint stress.

