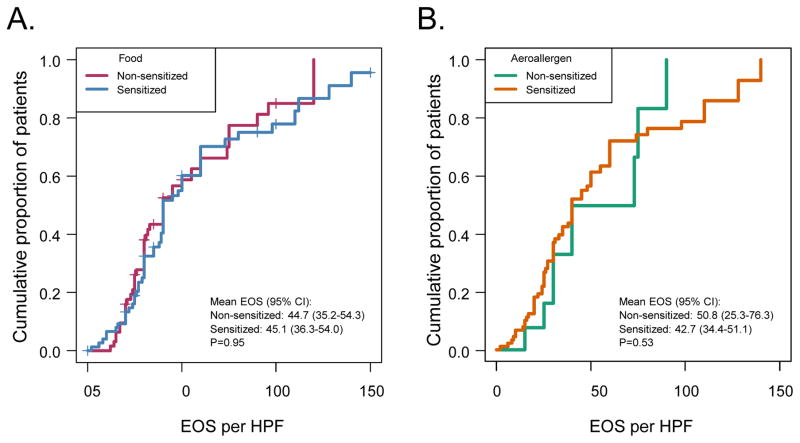
Figure 3.
Eosinophil levels on esophageal biopsy. The eosinophil (EOS) count per high power field (HPF) is represented as a cumulative proportion of patients (on y-axis) that have less EOS count per HPF listed (on x-axis). A) The food allergen sensitive (Blue) and non-food allergen sensitive (Red) patients were compared. B) The aeroallergen sensitive (Orange) and non-aeroallergen sensitive (Green) patients were compared.

