Fig. 10.
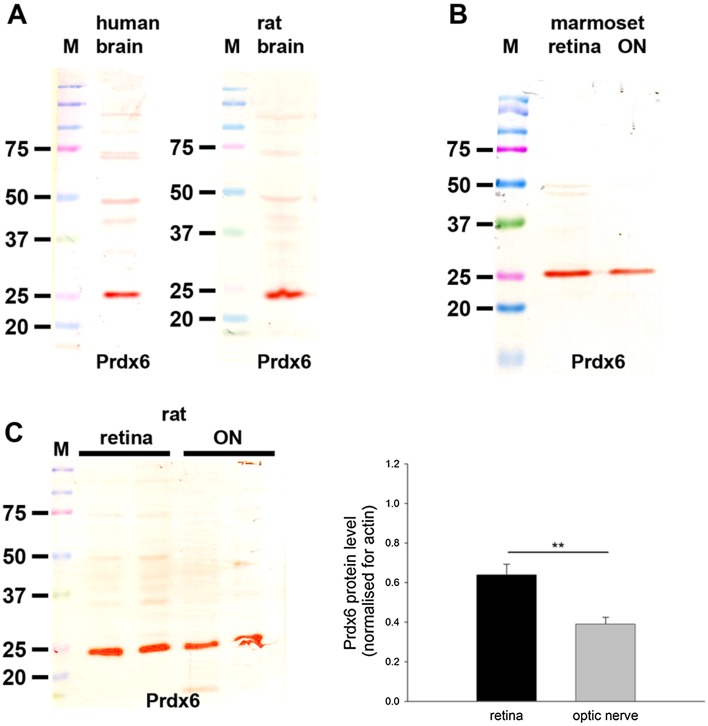
Western blot analysis of Prdx6 expression in brain, retina and optic nerve. Molecular weight markers (M, kDa) were used to determine size of detected gel products. a In tissue extracts from human and rat brain, a major band of the expected molecular weight (26 kDa) is apparent. b In tissue extracts from marmoset retina and optic nerve, a major band of the expected molecular weight is also apparent. c Representative immunoblots from rat retina and optic nerve tissue extracts, together with quantification of the levels of Prdx6 protein. All values (represented as mean ± SEM, n = 6) are normalized for actin, where ** P < 0.01 by Student’s unpaired t test

