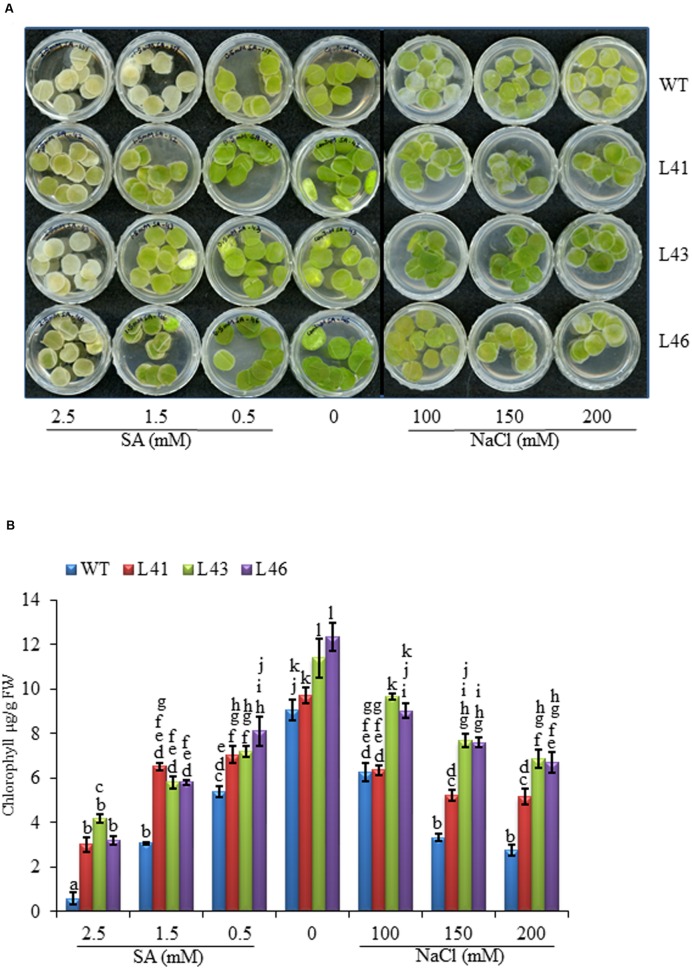
FIGURE 2.
(A) Leaf disk assay of WT and T0 transgenic lines (L41, L43, and L46) at different concentrations of NaCl (0, 100, 150, 200 mM) and SA (0.5, 1.5, 2.5 mM). (B) Chlorophyll analysis at different SA and NaCl concentrations. Values are represented as mean ± SD (n = 3) and marked with different alphabets to indicate significant difference at P ≤ 0.05 probability.

