Figure 5.
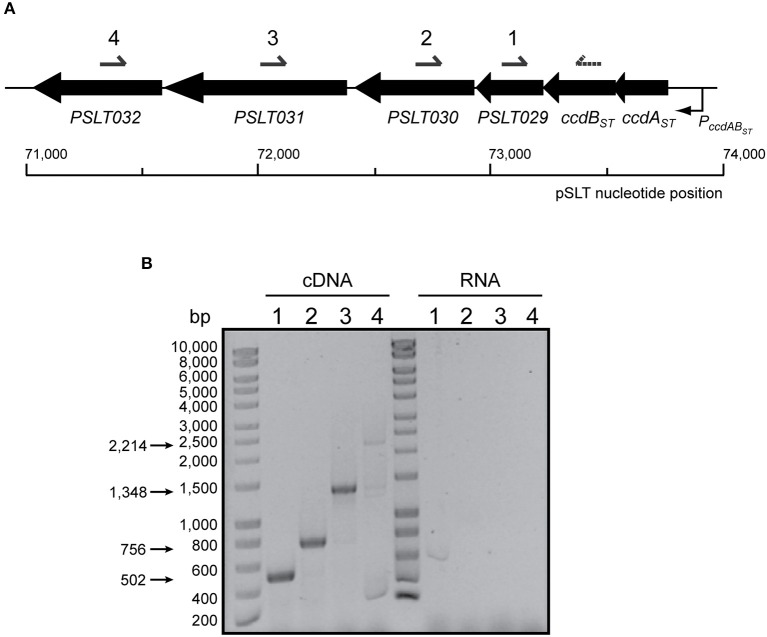
Genetic organization and transcriptional analysis of the ccdABST locus present in S. Typhimurium pSLT plasmid. (A) Genetic organization of ccdABST in S. Typhimurium pSLT. Black arrows represent the location and orientation of the genes (scaled). Under the scheme it is marked pSLT DNA sequence coordinates. Primers used for RT-PCR (number 4) and cDNA amplification (numbers 1–4) are denoted above. (B) Co-transcription analysis of ccdABST and downstream genes. cDNA was synthesized using a primer annealing with PSLT032 (named as 4). Primers named as 1, 2, 3, and 4 were used in combination to a primer annealing in 3′-end of ccdBST (dashed arrow) to PCR-amplify each region, and PCR products were resolved in a 0.8% agarose gel. DNA marker is shown on the left. The expected sizes of PCR-amplified DNA fragments are indicated with arrows on the left. All genes are co-transcribed with those encoding the ccdABST TA system.

