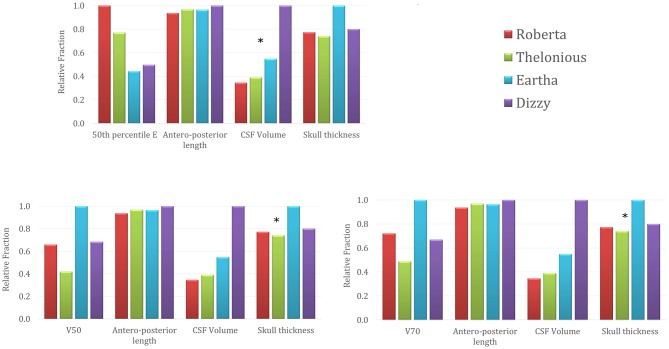
Figure 6.
50th percentile of the E amplitude in the cerebellum (top row), V50 (left) and V70 (right) percentages trends across the four models in comparison with the trends of three anthropometric quantities (i.e., maximum cerebellar antero-posterior length, cerebro spinal fluid (CSF) volume around cerebellum and maximum skull thickness in the occipital bone). The stars identify the anthropometric quantities showing a similar trend to the respective electric field quantity.

