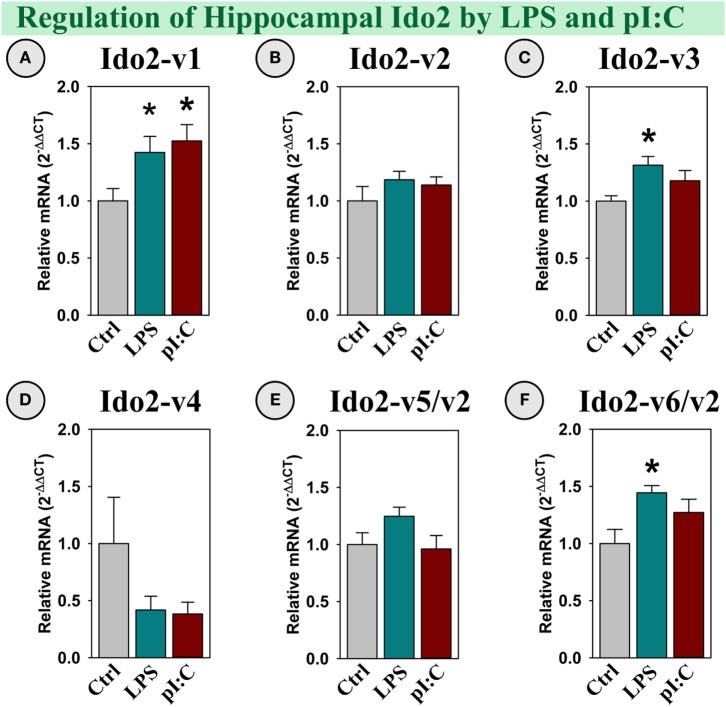
Figure 3.
Specific Ido2 transcripts expressed in the mouse hippocampus are increased by LPS and pI:C in vivo. Mice were administered saline (Ctrl), LPS, or pI:C and hippocampi were collected after 6 h. Expression of six Ido2 gene transcripts was measured. Expression levels are relative to Ctrl samples set to 1.0. *p < 0.05 for the effect of LPS or pI:C. Average Ctrl Ct values for each transcript: (A) Ido2-v1: Ct = 29.2, (B) Ido2-v2: Ct = 28.9, (C) Ido2-v3: Ct = 28.4, (D) Ido2-v4: Ct = 38.5, (E) Ido2-v5/-v2: Ct = 31.6, and (F) Ido2-v6/-v2: Ct = 28.3. Ct values indicate that Ido2-FL (non-detectable, not shown) and Ido2-v4 are essentially not expressed in naive (Ctrl) mouse hippocampi. Expression of other Ido2 transcripts are readily detectable in all samples.

