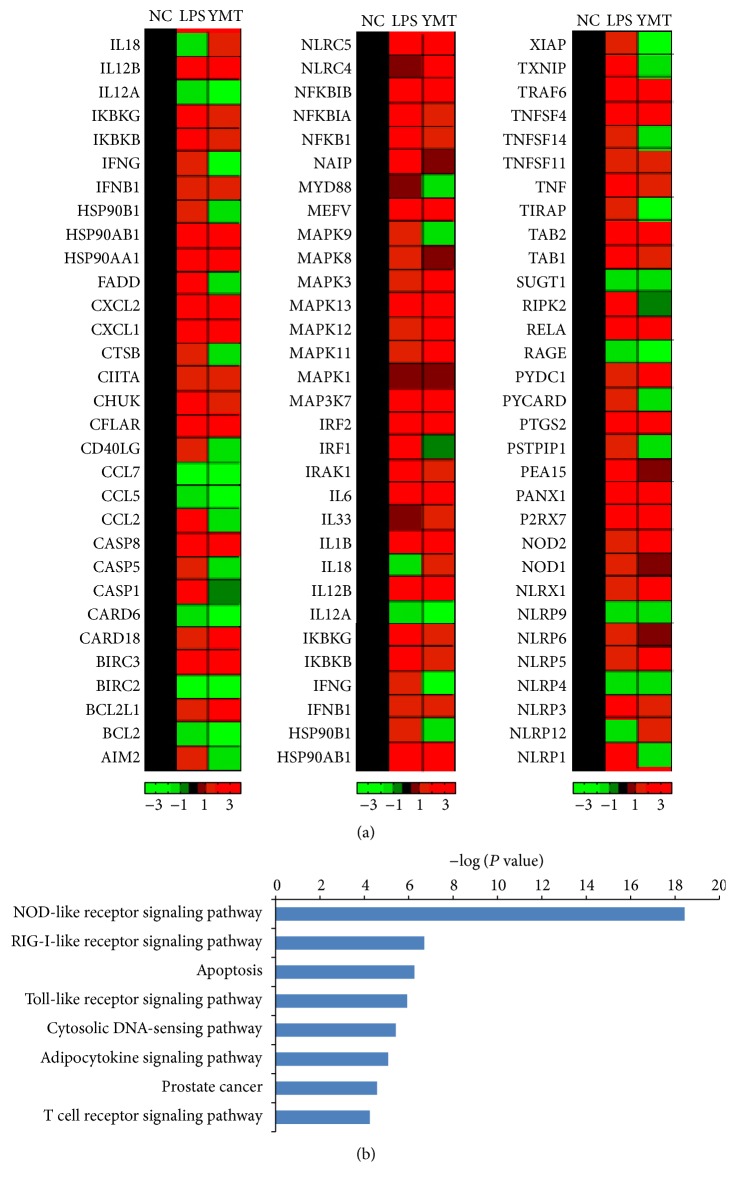
Figure 4.
The expression and distribution of differential inflammation-related genes. The results of cluster analysis of 84 inflammation-related genes (a). NC: cells in the NC group were cultured in RPMI-1640 culture medium containing 10% FBS. LPS: cells in the LPS group were stimulated with 1000 ng/mL LPS for 19 hours. YMT: cells in the group were pretreated with LPS for 1 hour prior to the treatment with YMT (0.75 mg/mL) for 18 hours. Black regions represent the gene expression in the NC group. Red regions represent the elevated gene expression compared to the NC group. Green regions represent the decreased gene expression compared to the NC group. The analysis results of differentially expressed genes in KEGG database (b).

