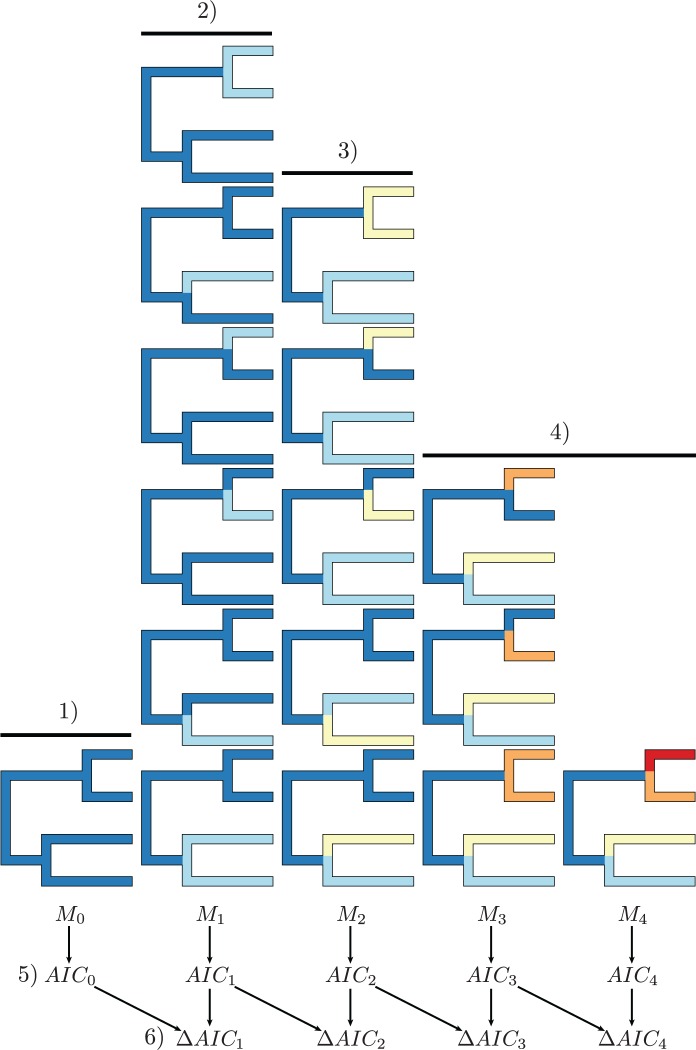
Figure 1.
The MEDUSA algorithm. 1) The one-rate model, , is first fit to the data using maximum likelihood. 2) Every possible two-rate model is then fit to the data, and the models are ranked by their likelihood score (with the best model, , at the bottom). 3) Every possible three-rate model that is consistent with the best two-rate model is then fit to the data, and the models are ranked as in the previous step. 4) Step 3 is repeated for increasingly complex models until the most complex model has been evaluated. 5) The AIC score is computed for the best model in each index (i.e., with rate shifts). 6) The AIC value is calculated for each pair of adjacent models (as the difference in their AIC scores). Each of the comparisons are evaluated in succession, where the more complex model is selected if the computed AIC value exceeds some prespecified threshold, . This process continues until either the most complex model is accepted or the improvement in the AIC score is too small to exceed the threshold.

