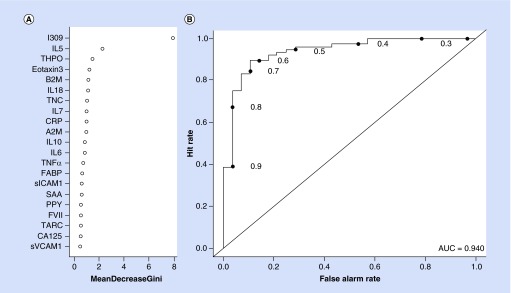
Figure 2. . Gini plot and diagnostic accuracy for Alzheimer's disease serum biomarker profile.
(A) Gini plot from random forest biomarker model demonstrating variable importance and differential expression of the top 21 markers of Alzheimer's disease among Panamanians. (B) Receiver operation characteristic plot for the Alzheimer's disease serum biomarker profile using 21 serum analytes. The AUC was 0.94, sensitivity was 0.86 and specificity was 0.90.
AUC: Area under the curve.

