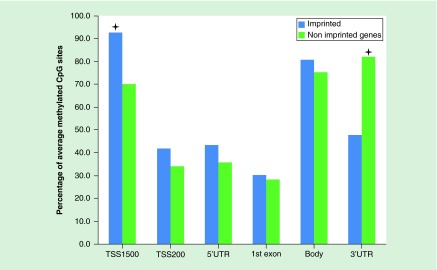
Figure 2. . Visualization of probes with beta-value in range of 0.5–0.7 for imprinted genes and nonimprinted genes.
Promoter region TSS1500 has the highest ratio of intermediately methylated probes in imprinted genes, while the smallest difference was detected in TSS200, 5′UTR, the first exon and gene body regions. The asterisks define the differences of 22.8 and 34.2% for TSS1500 and 3′UTR, respectively, being the only significant results for this analysis. The TSS1500 promoter area of imprinted genes contains 22.8% more 0.5–0.7 β-value probes than nonimprinted genes (p = 6.57 × 10⁻⁵). The 3′UTR area of imprinted genes has 34.2% less 0.5–0.7 β-value probes than nonimprinted genes (p = 6.2 × 10⁻¹³). The differences in the TSS200, 5′UTR, the first exon and gene body were only 7.9, 7.3, 2.2 and 5.7% (p = 0.2128, p = 0.2578, p = 0.7929, and p = 0.338), respectively; being insignificant after multiple correction.
TSS: Transcription start site.

