
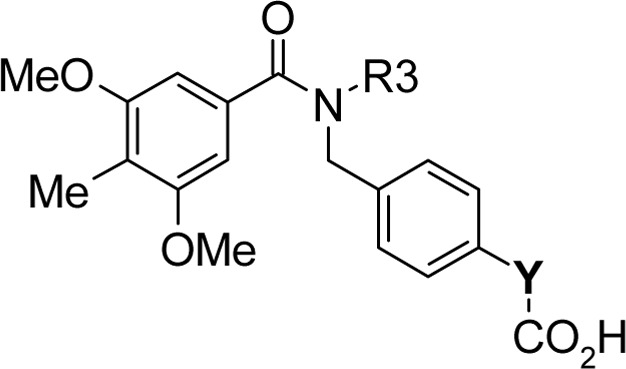
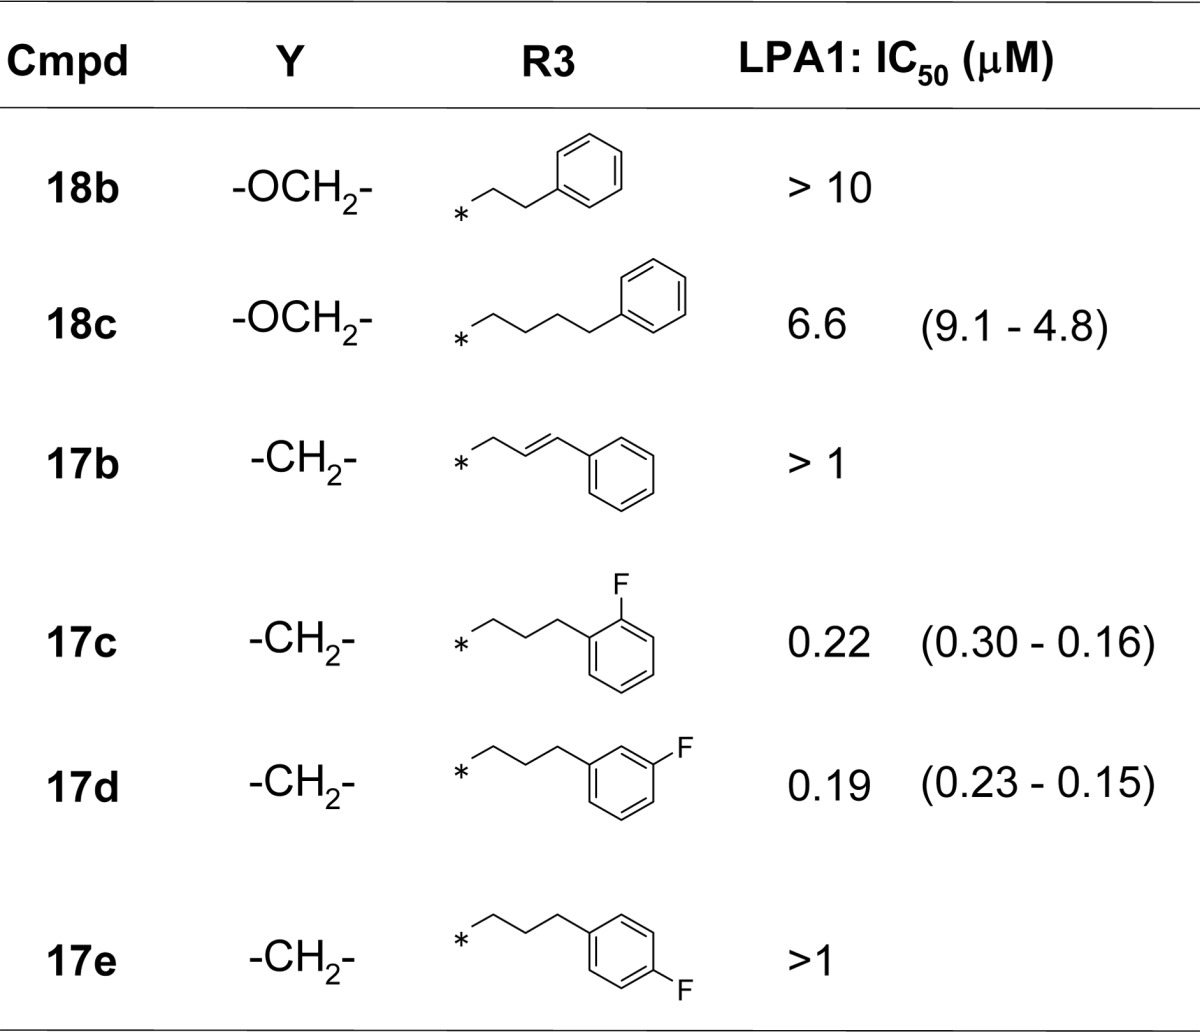
Table 3. Structure–Activity Relationship for Section Ca.
a
IC50 values were determined by nonlinear regression analysis of the dose–response curves (5 points) generated using GraphPad Prism ver.5.04 with 95% confidence intervals in parentheses.
Official websites use .gov
A
.gov website belongs to an official
government organization in the United States.
Secure .gov websites use HTTPS
A lock (
) or https:// means you've safely
connected to the .gov website. Share sensitive
information only on official, secure websites.
IC50 values were determined by nonlinear regression analysis of the dose–response curves (5 points) generated using GraphPad Prism ver.5.04 with 95% confidence intervals in parentheses.